2026 Capital Markets Forecast
Jan 12, 2026
Entering a new year rarely comes with certainty about market behavior, but today, the level of uncertainty feels especially high. Is artificial intelligence (AI), with its massive capital investments aimed at future profits, forming a bubble reminiscent of the internet era? That period ultimately transformed our lives, but only after a sharp market correction nearly 25 years ago. Or will AI deliver growth and profitability beyond even the most optimistic expectations?
Meanwhile, questions remain about inflation: Will it be fully contained amid renewed political focus on affordability as midterm elections approach, or will tariffs and other pressures push it higher? Consumer confidence is muted yet spending remains resilient, driven in part by higher-income households, giving rise to the term “K-shaped economy” (see our Spotlight for more on this trend).
We do not view the current environment as a bubble, whether driven by AI or other factors. Strong corporate earnings, rising valuations, and emerging productivity gains from AI (we count ourselves among the “true believers”) continue to support a positive outlook for the economy and equity markets. At the same time, we remain mindful of risks ahead, even as global economic instability eases and trade negotiations progress. Accordingly, we maintain the Neutral stance on public market equities that we adopted in mid-2025 (see our Near-Term Sentiment section for detailed outlooks across asset classes).
Core and core-plus US bonds remain Neutral to Positive in our view. We recommend that long-term investors begin reducing dedicated short-term bond allocations in 2026 as we anticipate further rate cuts. Given potential volatility, this is an opportune time to reassess portfolio risk, ensuring alignment with long-term growth objectives without taking on excess exposure. In today’s environment of tempered optimism and manageable risk, there may be opportunities to further diversify, such as in private debt investments (see our Private Debt Outlook section).
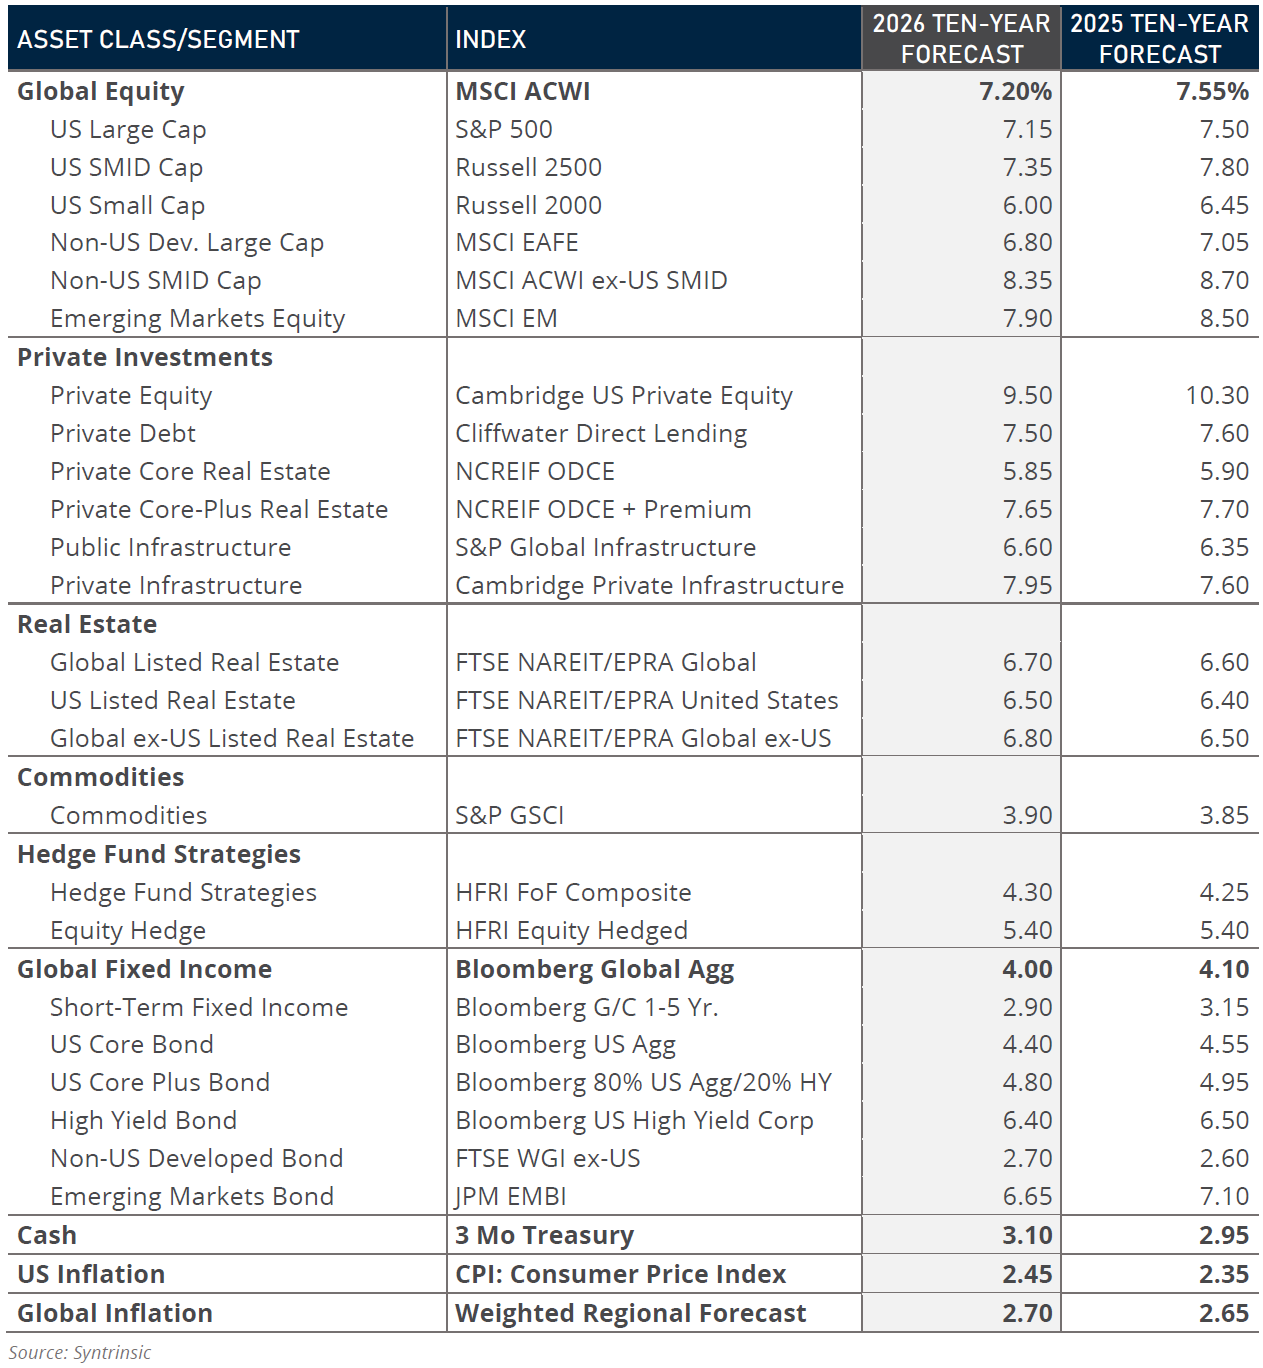
For more than a decade, Syntrinsic has published its annual Capital Markets Forecast to guide long-term strategic asset allocation and inform near-term tactical decisions. Our long-term return assumptions for each asset class are grounded in quantitative building blocks, providing a rational and measurable framework for anticipating returns across equities, fixed income, real estate, commodities, hedge fund strategies, and private investments. Our near-term sentiment reflects opportunities and risks with a three-year perspective.
We look forward to sharing this 2026 outlook and discussing the year ahead with you.
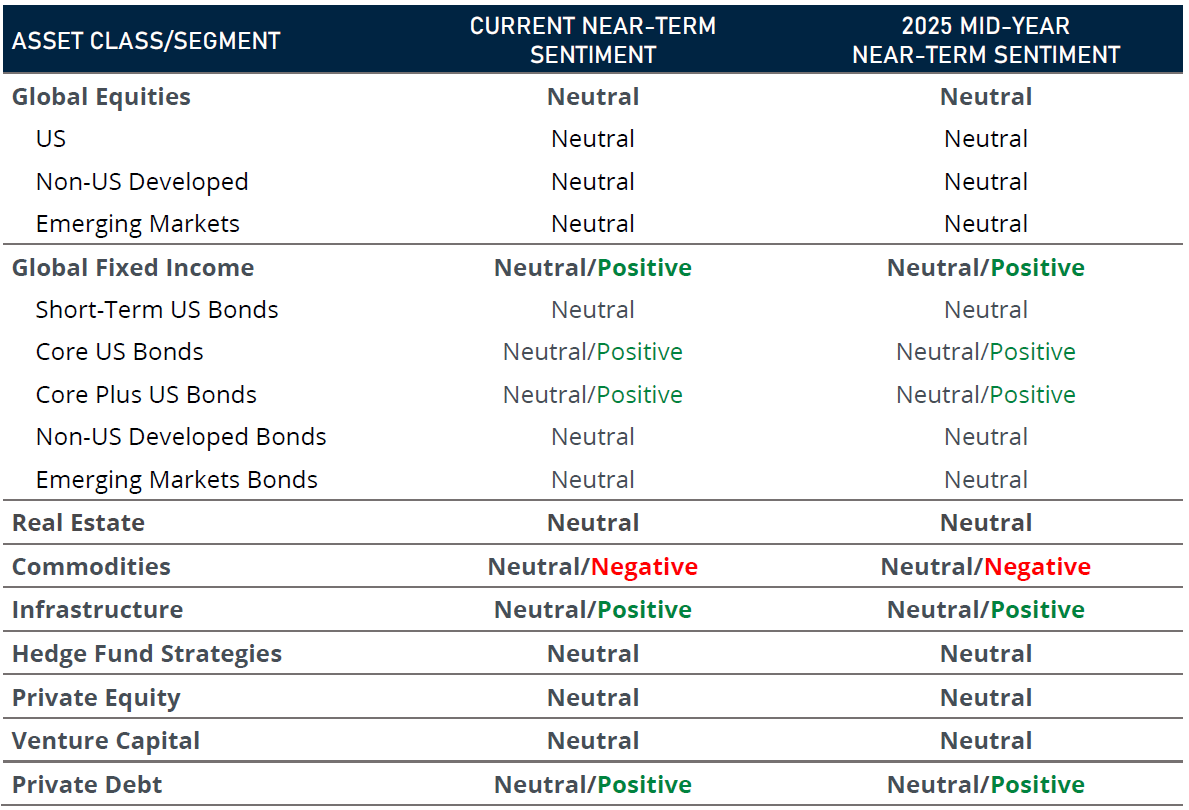
We maintain the Neutral stance on public market equities, both US and non-US, that we adopted in Syntrinsic’s 2025 Mid-Year Capital Markets Outlook. We are not making any additional changes to our sentiment at this time.
We suggest clients take a long-term perspective and maintain their public equity allocations while continuing to build on private market allocations where appropriate given objectives. If Federal Reserve rate cuts stay on course in 2026, we expect to discuss moving out of dedicated short-term bond allocations into other asset classes, depending on risk posture.
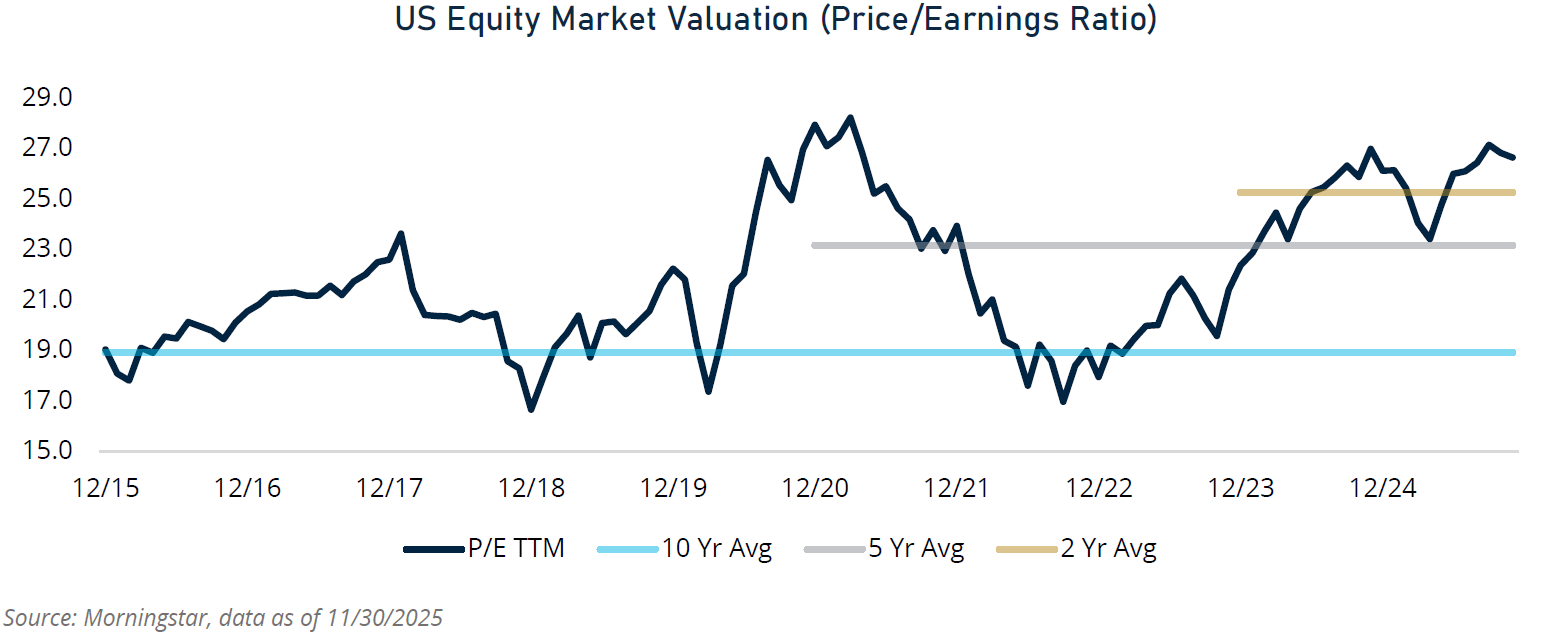
In a market “bubble”, asset prices rise rapidly to levels far beyond their fundamental value, typically fueled by investor optimism and speculative behavior rather than underlying economic drivers like earnings growth. Today, record-high stock markets—led by large technology and AI-focused companies—combined with elevated valuations (as reflected in price-to-earnings ratios and other metrics), massive corporate spending on AI infrastructure that will require significant future profits to justify, and broader uncertainty about the economic outlook have led some to question whether we are in a bubble now.1
While valuations are high and global uncertainty persists, these dynamics underscore the importance of discipline rather than reaction.
AI-related investments extend beyond equities into other asset classes, including data centers, energy infrastructure, and private equity and credit financing. Recently, major AI “hyperscalers”—the largest firms operating extensive data centers and cloud services—have even tapped public debt markets to fund future expansion.
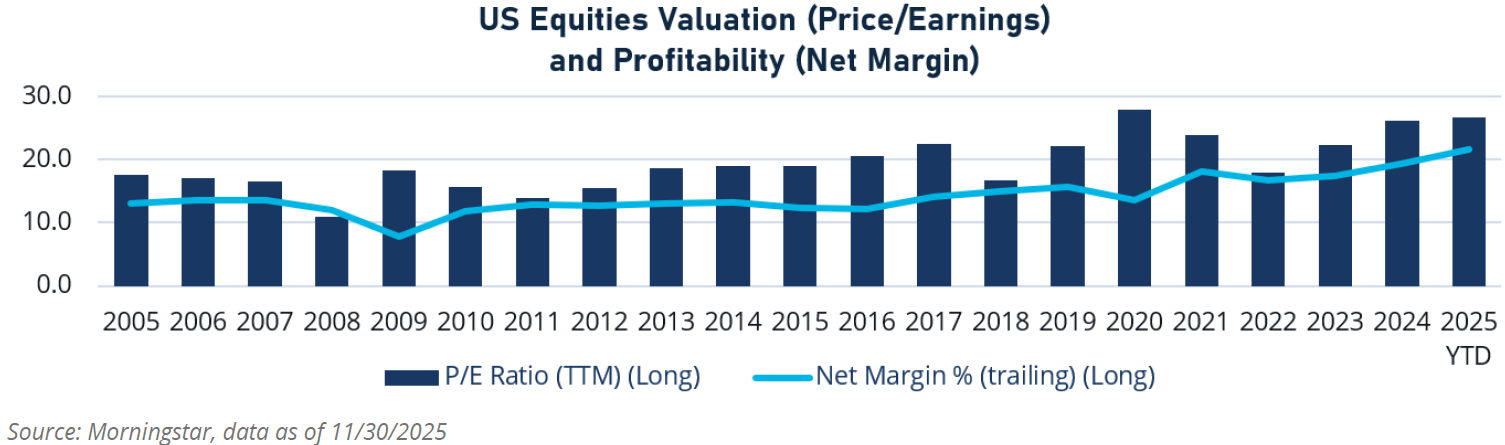
While we acknowledge the risks in a market driven by companies with high valuations, we do not consider the market to be in bubble territory, nor do we believe that imminent correction is likely, either for the broader market or the AI sector specifically. We expect continued AI buildout, resilient corporate earnings, and supportive US policies to underpin growth. Valuations, though elevated, remain supported by strong corporate profit margins—unlike the 1999 technology bubble. We believe AI will drive long-term structural changes in the economy and labor markets, potentially boosting productivity and efficiency beyond even current optimistic forecasts, though we recognize that the path forward may involve volatility and uneven progress.
The coming decade will likely diverge from historical norms, with global markets becoming less synchronized amid a more fragmented world. Higher uncertainty may become the new normal, contributing to persistent volatility.
While valuations are elevated and global uncertainty persists, these dynamics underscore the importance of discipline rather than reaction. We do not believe that the current market environment, in AI and more broadly, constitutes a “bubble,” in which valuations and sentiment far outpace likely future outcomes of profitability and growth. Rather, we believe that increased productivity and profit will ultimately justify expenditures and valuations, though the room for error is not wide. Market cycles and structural shifts are inevitable, and timing them successfully remains highly challenging. Investors should maintain a long-term perspective and emphasize diversification across regions, asset classes, and sources of return to navigate an increasingly fragmented world.
Consumer spending is the cornerstone of the US economy, accounting for roughly 70% of GDP—far higher than in more production-driven economies like China, where consumer spending is under 50% of GDP. Despite a steady decline in consumer sentiment since the pre-pandemic period, US consumer spending has remained resilient. However, differences in spending patterns between higher- and lower-income households have fueled discussion of a “K-shaped” economy—where wealthier consumers continue to grow in wealth and spending, while less affluent households struggle. Is that what we’re seeing today?
Analyzing spending by income level is more complex than it seems, as there is no centralized tracking system. Most studies rely on credit card data samples. One widely cited study from February 2025 suggested that the wealthiest 10% of consumers (annually earning $250,000+) account for at least half of all spending. While this finding sparked debate, other researchers have challenged its assumptions, noting the real figure may be higher than 10% but well below 50%.2
During and immediately after the pandemic, lower-income households saw faster spending growth than higher-income households, driven by stimulus payments and post-reopening hiring. That trend reversed as lower-income spending declined, only recovering in mid-2023. More recently, higher-income spending growth has outpaced that of lower-income households.3
Historically, wage growth has supported consumption, with higher-income workers enjoying faster increases over decades. Most specifically, the latest Social Security data shows this disparity, highlighting that from 1979-2023, the top 1% wages have grown over 180% while the bottom 90% saw much smaller gains of around 44%.4 Post-pandemic, this trend briefly reversed, with lower-income workers seeing stronger percentage gains (though smaller in dollar terms), but overall this inequality still persists.
While wage growth has been a key driver of consumption, the wealth effect also plays a significant role: as assets such as stocks and homes appreciate, people tend to feel more financially secure and increase spending. Stock market performance is often cited as a catalyst for discretionary “splurge” purchases among affluent households.
While the top 1% still hold about 50% of corporate equities and mutual funds—notably, down from levels in 2019 and also 1995—stock ownership has broadened, with more than half of low- and middle-income Americans now owning equities.5 However, much of this wealth is concentrated in retirement accounts, reflecting the long-term shift from defined benefit to defined contribution plans. As a result, it remains unclear whether rising 401(k) balances meaningfully influence short-term spending behavior or contribute to the observed spending gap.

Consumption is continuing to grow across all income levels, though more slowly for lower-income households. Surveys by the Philadelphia Fed show that most respondents, regardless of income, are consciously trying to reduce spending—primarily due to rising costs of goods and services, and concerns about affordability.6
Affordability has become a political flashpoint, likely to dominate the 2026 midterm elections. While overall inflation remains moderate, housing, food, and healthcare costs—essentials that disproportionately impact lower-income households—are driving concerns and inequalities.
It does appear that we are experiencing a K-shaped recovery based on some of the data showing the inequality in income and assets and consumer spending powers the US economy. So, any sustained decline in spending from higher-income households could trigger a self-reinforcing slowdown.
For higher-income households, risks include white-collar job cuts from economic weakness or AI-driven automation, as well as a potential stock market correction. For lower-income households, widespread job losses remain the biggest threat.
Our base case does not anticipate a recession in 2026, driven by consumer spending or other factors. However, risks persist. Longer term, policymakers will face pressure to address affordability—whether through boosting growth and supply, controlling prices, or other measures. Meanwhile, structural inequality may endure, shaped by wage disparities and uneven participation in equity markets. The evolving impact of AI on labor markets, particularly white-collar jobs, could complicate these dynamics before solutions emerge.

ELI DAVIDOFF
Research Analyst
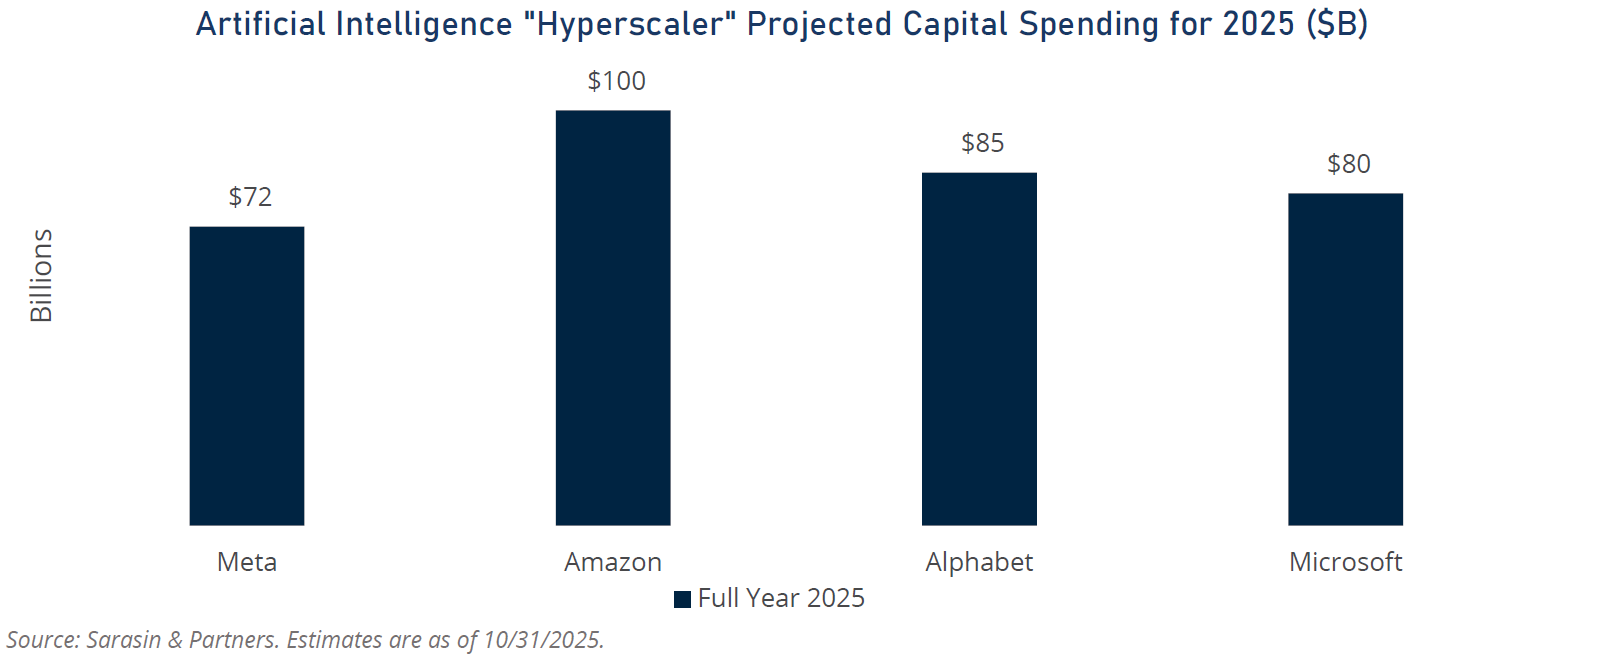
Artificial intelligence (AI) has advanced rapidly this year, both in terms of new technologies and in the scale of corporate investment. Major firms are committing unprecedented capital to build proprietary AI infrastructure. For example, as of the time of this writing in late December 2025 (based on October 31 data), Amazon is projected to spend approximately $100 billion in 2025, primarily on AI infrastructure, cloud platforms, and generative AI development.
Similarly, Alphabet is expected (as of late December 2025, based on 10/31 data) to invest about $85 billion in 2025, focusing on foundational AI models, data center expansion, and cloud-based AI services. These investments are complemented by aggressive efforts to attract top engineering talent through substantial financial incentives and stock options.
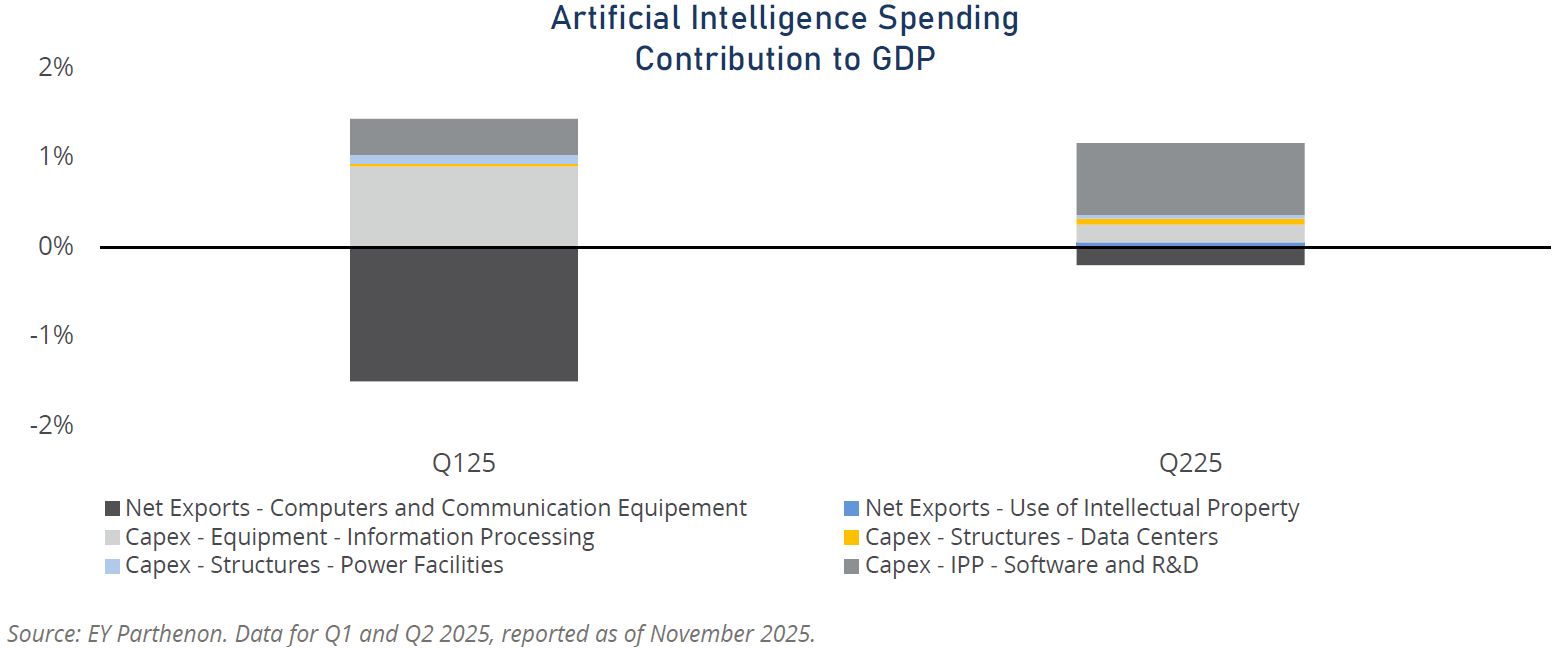
While these developments have contributed to GDP growth year-to-date, questions remain: Will AI-driven productivity gains justify these massive expenditures? And will automation lead to significant job displacement?
Historically, consumer spending has accounted for more than two-thirds of US economic activity. This year, however, corporate investment in AI infrastructure has emerged as a primary driver of growth, a notable shift from traditional GDP contributors. In the first half of 2025, AI-related business investment added roughly 1.6% to GDP growth7, outpacing consumer spending.
Companies at the forefront of AI innovation—and those building the infrastructure to support it—have seen extraordinary stock price gains this year. Broadcom, Nvidia, Alphabet, and Meta have returned 60%, 51%, 49%, and 11%, respectively year-to-date as of October 31, 2025. These gains have had an outsized impact on the broader market: as of October 31, 2025, these firms accounted for 44% of the Bloomberg 500 Index’s total return for the year.
As noted in our Spotlight: Talking About a Bubble section, these trends have led some to speculate that we are in an AI-driven market bubble. We do not share that view, though we acknowledge the potential risks and volatility inherent in this transformative period.
Past innovations—from the wheel to the internet—amplified human productivity by enabling people to do more. AI “co-workers” capable of processing information at speeds far beyond human capacity and operating tirelessly could drive productivity gains to an unprecedented scale.
In our view, widespread adoption of AI use cases could cause displacements in the US workforce over time, potentially creating transitional unemployment as workers shift to new roles and sectors. Recent layoffs, such as those announced by Amazon, underscore early signs of automation-driven workforce changes.
Despite the headlines, AI integration remains in its early stages. A recent McKinsey survey found that 88% of businesses report using AI in at least one function, up from last year, but only one-third have scaled AI programs.8 Most current applications focus on simple tasks—email review and content creation—rather than embedding AI into workflows that drive real productivity and cost efficiencies.
Addressing labor market disruptions will require thoughtful social policies, potentially including benefits or guaranteed income programs. At the same time, human-AI collaboration, rather than outright replacement, offers a promising model for the future of work.
Prior to the COVID-19 pandemic and its aftermath, inflation was low and stable, with short-term interest rates below the Federal Reserve’s 2% target. When COVID-19 spread in early 2020, inflation initially declined as demand collapsed. By March 2021, however, inflation surged to levels not seen since the 1980s, driven by both demand- and supply-side shocks. On the demand side, pent-up consumer spending was amplified by government stimulus. On the supply side, disruptions in global supply chains, labor shortages, and energy price spikes—exacerbated by the Russia-Ukraine war—added significant pressure.
To curb inflation, the Federal Reserve began its tightening cycle in March 2022, aiming for disinflation (prices rising but more slowly) and a “soft landing.” This trajectory was challenged in April 2025 with the introduction of “Liberation Day” tariffs. While many expected a sharp inflation spike, the impact has been muted so far, thanks to postponed tariffs, preemptive inventory purchases, and companies absorbing cost increases, and/or passing them on gradually rather than suddenly.
Due to the US government shutdown, CPI data releases have been delayed. Inflation was 2.7% in November. The Fed remains caught between its dual mandates: price stability and maximum employment.
Markets entered 2025 anticipating swift rate cuts. However, with inflation and employment data trending within a constructive range, the Fed held the Federal Funds Rate steady until September. By fall, resilient inflation and low unemployment supported three consecutive 0.25% cuts at the September, October, and December FOMC meetings.
Fed Chair Jerome Powell highlighted four policy areas under the Trump administration that could influence the Fed’s mandates: deregulation, immigration policy, trade/tariffs, and fiscal policy. These remain key watchpoints for 2026.
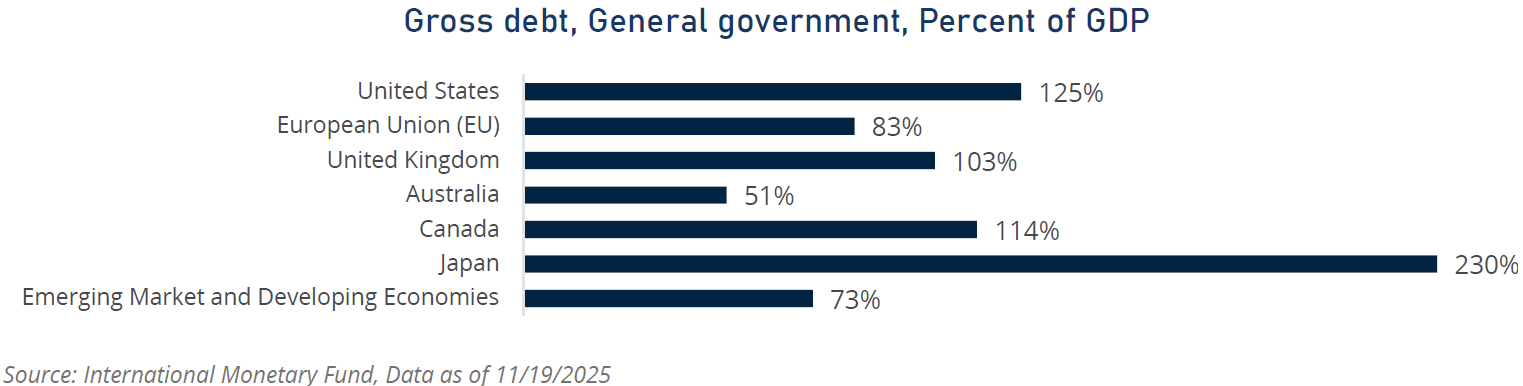
Fiscal policy briefly dominated headlines in the first half of 2025 during negotiations over the One Big Beautiful Bill Act, which ultimately passed in July 2025 and expanded the federal deficit. Interest payments on US Treasury debt now account for 19% of the federal budget, underscoring growing fiscal constraints.
While fiscal policy does not directly dictate the entire Treasury yield curve, it matters greatly to long-term lenders. We expect upward pressure on long-dated maturities (20–30 years) as concerns about debt sustainability mount. This dynamic, combined with other factors, points to further yield curve steepening in 2026.
We expect further US yield curve steepening into 2026

JAS CHEN, CFA
Senior Analyst
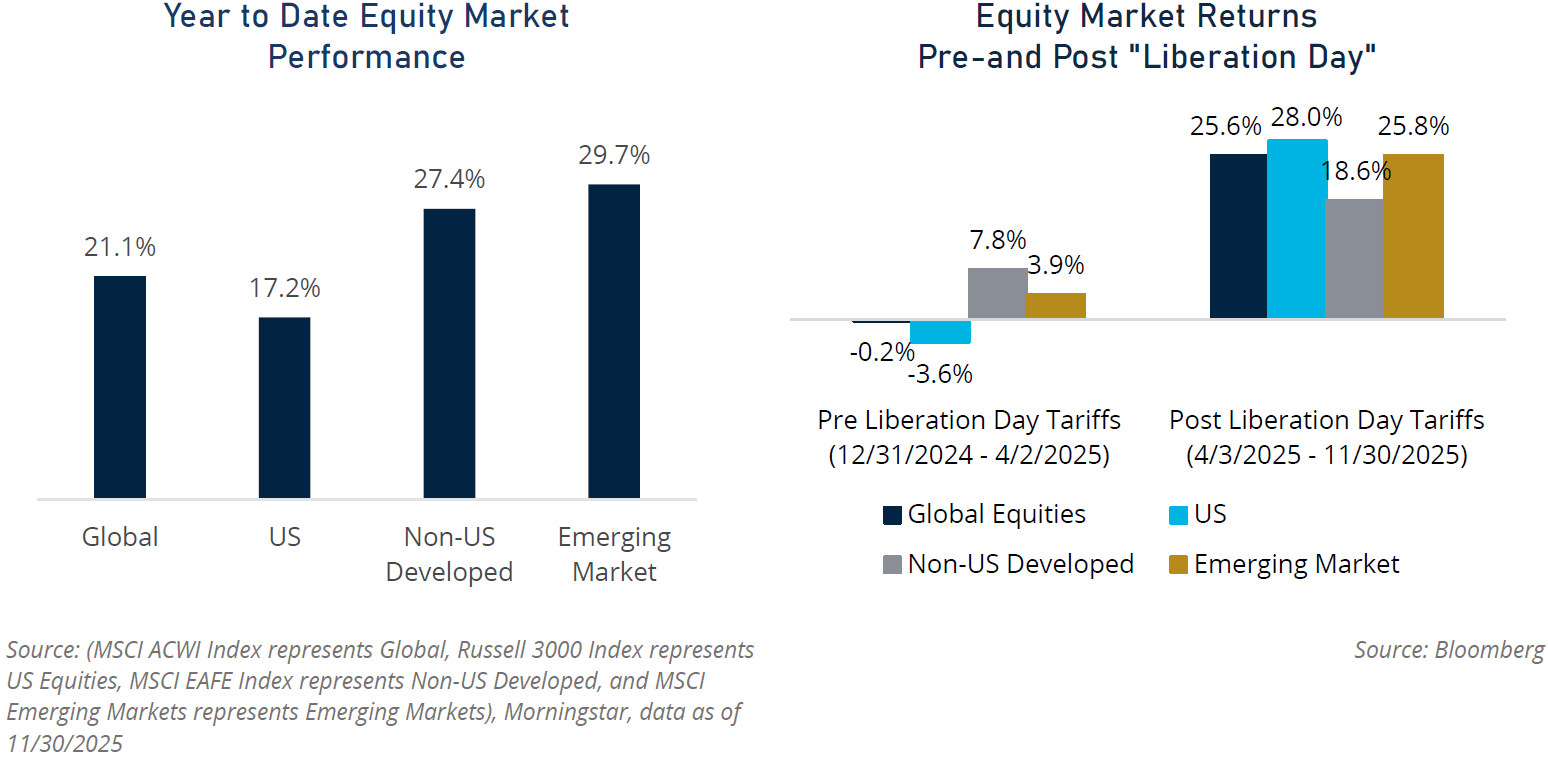
Global equity markets reached record highs in 2025 despite elevated uncertainty worldwide.9 In the first half of the year, US tariff policies disrupted market optimism, triggering sharp declines in April following the “Liberation Day” tariff announcements. However, equities rebounded quickly in the second half of 2025, supported by greater clarity on global trade, renewed expectations for US interest rate cuts, and surging enthusiasm for artificial intelligence (AI) investments.
Year-to-date performance has varied across regions, with non-US equities leading—a reversal from the past decade of US dominance, driven largely by a weakening dollar. US exceptionalism faced challenges throughout the year amid tariff uncertainty, fiscal deficit concerns, and disruptions from a record-breaking government shutdown. Yet, that exceptionalism has not fully faded: US equities recovered strongly in the back half of the year, buoyed by resilient consumer spending (primarily among higher-income households) and continued AI-driven optimism, ultimately reaching new all-time highs.
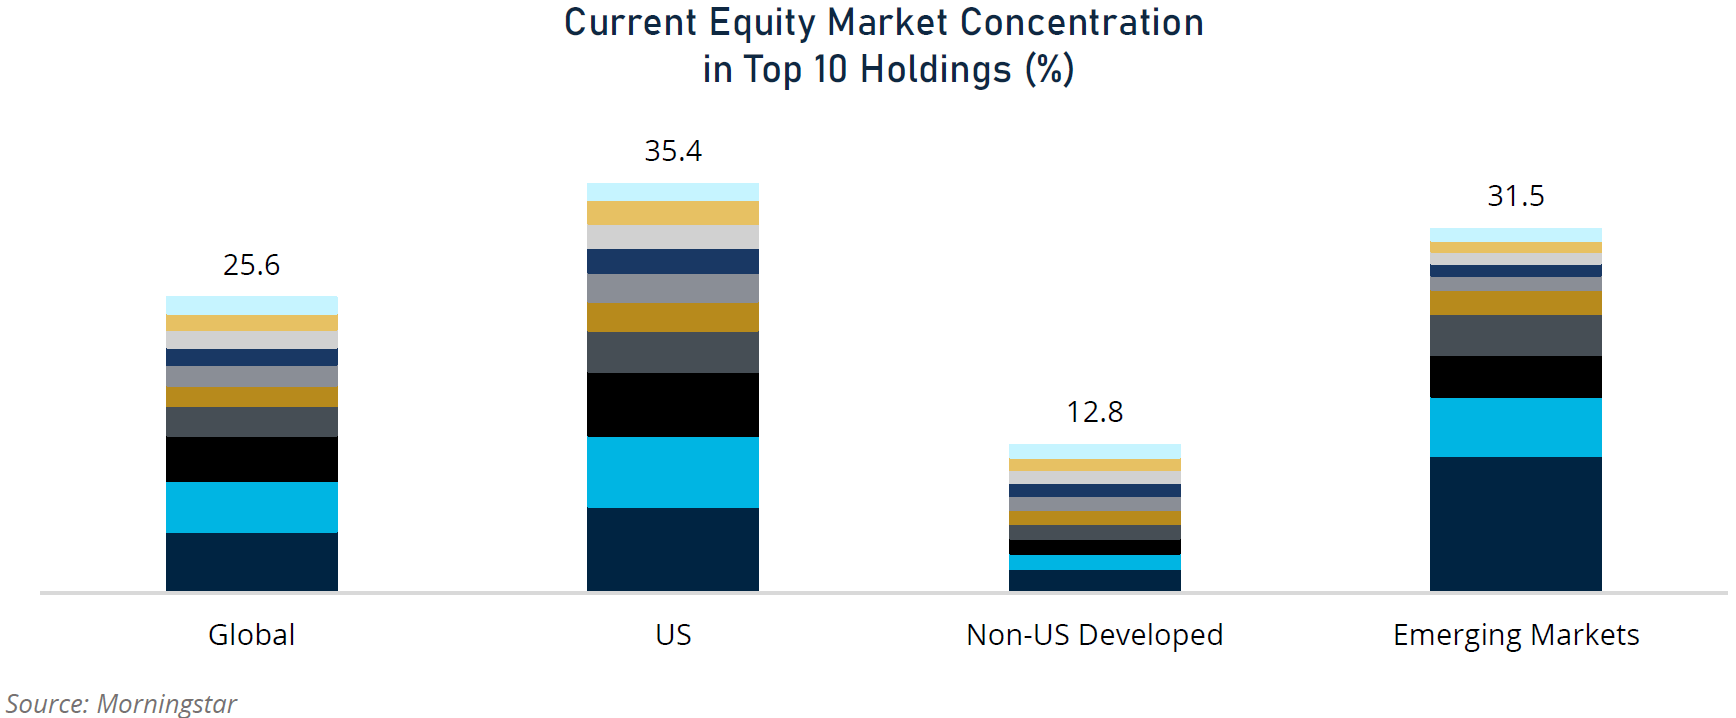
We remain cautious about risks on the horizon, even as global economic instability eases and trade negotiations progress. A mix of softening and desynchronized global growth, coupled with persistent inflation, marks a departure from prior market cycles and may lead to fragmentation across regions. Within US equities, high concentration, historically elevated valuations, and late-cycle dynamics leave little margin for error. While trend-following strategies have worked well this year, maintaining focus on fundamentals and earnings is essential. Accordingly, our near-term sentiment for global equities remains Neutral, and we continue to recommend broad diversification across regions.
Within global equities, we continue to segment companies by domicile—United States, developed markets outside the US, and emerging markets. While this approach is imperfect in today’s globalized economy dominated by multinationals, it reflects meaningful differences in the rule of law, central banking, regulatory frameworks, financial system maturity, and consumer and business wealth.
Our near-term sentiment on US equities remains Neutral, supported by growth-oriented policies, sustained spending from the artificial intelligence (AI) boom, and fading trade uncertainty. These factors could provide a second wind for US economic growth, extending the current market cycle. However, risks persist, including rising cost pressures from tariffs, evolving labor market dynamics, and a resilient yet concentrated consumer base.
Policy Tailwinds
Growth-oriented fiscal measures may prolong the cycle. Reduced uncertainty around trade policies is improving business confidence, while declining interest rates benefit borrowers and increase the present value of future cash flows. Policies such as the One Big Beautiful Bill incentivize investment in equipment and research and development by allowing full expense deductions—immediately lowering tax liabilities and boosting cash flows. Additionally, lower household tax burdens could stimulate consumer spending.
AI-Driven Growth
The surge in AI-related spending during 2025 was a key driver of US economic growth and is likely to persist into 2026. Adoption of AI across businesses continues to accelerate, fueling demand for chips, data centers, and related infrastructure. However, supply constraints remain significant. Infrastructure investments take time to build, rare earth materials are scarce, and rapid innovation shortens equipment life cycles. Monetizing AI investments will require precise execution, particularly given today’s elevated valuations and market concentration.
Tariffs and Inflationary Pressures
Tariffs remain a headwind for both economic growth and inflation control, despite playing a role in narrowing the deficit gap. While businesses can absorb some tariff-related costs, consumers ultimately bear much of the impact. Harvard economists tracking retail prices through October using real-time barcode data reported an average domestic retail price increase of 4.9% relative to the pre-tariff trend (not equivalent to CPI inflation).10 Moreover, the average US tariff rate now stands at its highest level since the 1940s—even if the Supreme Court overturns tariffs enacted under the International Emergency Economic Powers Act (IEEPA), since many current tariffs are non-IEEPA. Although tariff uncertainty has largely faded, we do not expect tariffs to disappear soon. Pricing pressures will likely persist, tempering consumer spending in 2026 and potentially dragging on real GDP.
Labor Market Dynamics
US labor markets have potentially softened enough for the Federal Reserve to pivot its dual mandate focus away from inflation, as job creation slowed meaningfully, though the push and pull between the mandates persists. The modest headline unemployment rate likely reflects lower labor force participation combined with weakening labor demand. Coupled with an aging demographic, current immigration policies may further constrain labor supply, reducing the working-age population and slowing job growth—partially offsetting productivity gains from AI.
Consumer Spending and the K-Shaped Economy
Consumer spending—the largest component of GDP—remains resilient but increasingly reliant on a narrower base of higher-income households. Strong equity market returns have generated wealth effects that sustain spending, to a degree, among affluent consumers. In contrast, lower- and middle-income households face diminished capacity to spend, as wage growth lags inflation.
Tariff-driven cost pressures and a softening labor market exacerbate this divide, contributing to a “K-shaped” economy increasingly dependent on households whose spending is tied to higher income and wealthier consumers (see our Spotlight section). Additionally, AI adoption has disproportionately impacted white-collar jobs, suggesting that a significant market correction could negatively affect future spending capacity.
Our near-term outlook for non-US developed and emerging markets remains Neutral. Emerging markets offer relatively higher growth expectations, while valuation differentials in developed markets may continue to narrow. The AI boom could serve as a tailwind for emerging markets, particularly for countries integrated into global supply chains or positioned as AI competitors to the US. Meanwhile, pro-growth reforms in developed markets aim to reduce reliance on the US, providing fundamental support to narrow valuation discounts. However, execution risks persist amid trade and geopolitical tensions, inflationary pressures, and fiscal challenges.
Europe
Since early 2025, the European Union has launched several pro-growth initiatives, including increased defense spending, regulatory changes, and supportive fiscal policies. Many member states have committed to boosting defense budgets, with projections indicating an additional €100 billion by 2027.11 While higher defense spending may stimulate short-term growth and generate long-term industrial benefits, fiscal debt challenges and widening deficits pose headwinds. As of Q2 2025, euro area government gross debt-to-GDP reached 88.2%, up from 87.7% a year earlier. Structural issues—aging populations, lagging productivity, and fragmented markets—may further constrain growth.
Japan
Japan’s new Prime Minister, Sanae Takaichi, has signaled plans for expansionary fiscal policies and strategic investments to stimulate growth. However, persistent inflation above target limits the Bank of Japan’s ability to provide monetary support, while fiscal deficit challenges could restrict the execution of growth-oriented initiatives.
Emerging Markets
Emerging markets equity returns benefited significantly from a weakening US dollar in 2025, and further softening could lift regional performance for US investors. AI spending initiatives have supported growth in countries such as South Korea and Taiwan and are expected to continue. In China, increased defense spending and AI investments provide some support, but deflationary pressures, sluggish labor markets, and a challenged property sector remain significant headwinds. Given China’s economic maturity, base effects on growth are fading, and additional fiscal stimulus will likely be needed to counteract the slowdown. Despite global trade uncertainty, India remains one of the fastest-growing major economies, driven by a low base effect and fiscal stimulus. In general, across emerging markets countries, US immigration policies may also lead to the return of skilled human capital in China, boosting labor supply and productivity.
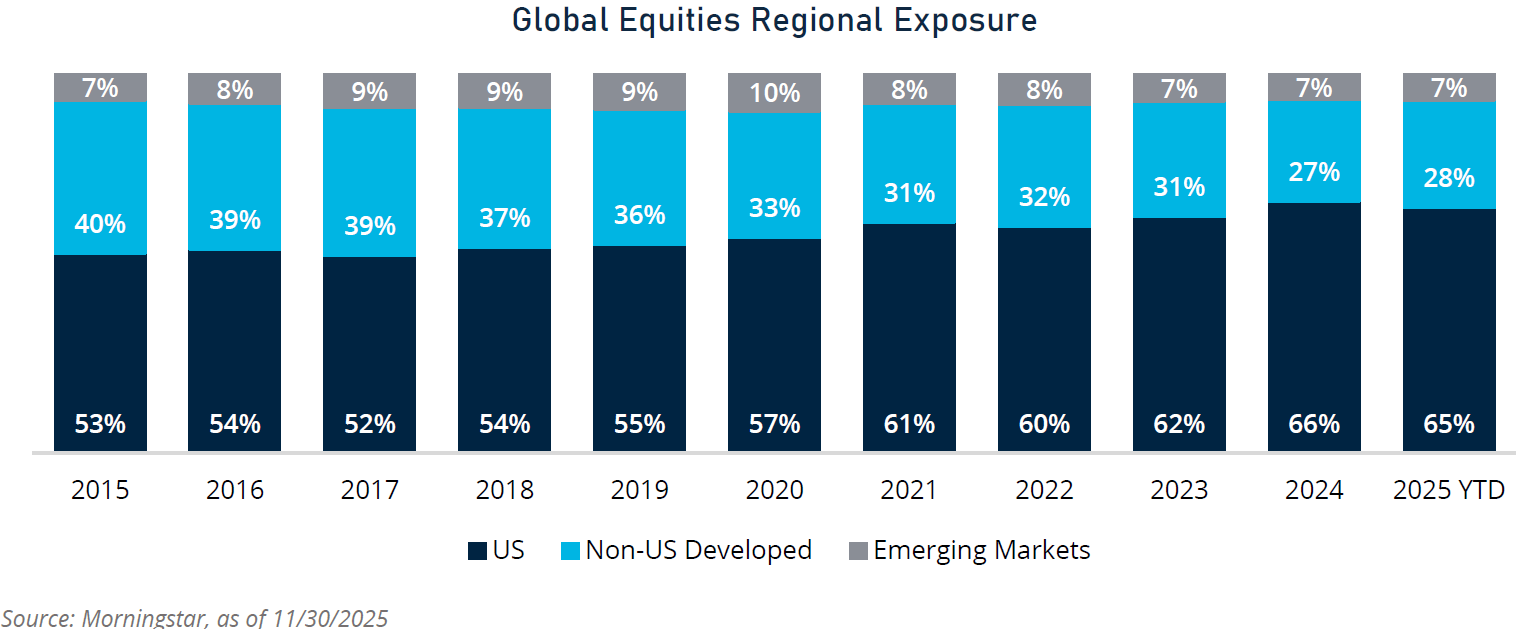
We recommend maintaining a modest strategic tilt toward US equities relative to their proportion in the global equity markets, with our 70/30 target allocation unchanged, even as the US share of global market capitalization has stayed stable at about 65%. Within US equities, we favor large- and mid-cap companies while de-emphasizing publicly traded small caps. Outside the US, we focus on firms with strong growth prospects and prioritize governance and transparency to protect investors.

MATT KUKLA
Senior Analyst
Looking back, the rapid interest rate hikes by the Federal Reserve in late 2022 and throughout 2023 to combat inflation brought private equity activity to a near standstill—deal flow, exits, distributions, valuations, returns, and fundraising all declined. Limited exits muted distributions to limited partners (LPs), creating negative cash flows and liquidity pressures. As a result, many LPs have shifted focus from internal rates of return (IRR) to distributed to paid in capital (DPI).
Despite this backdrop, we entered 2024 with a Neutral/Positive outlook on private equity, anticipating Federal Reserve rate cuts—which did occur, three times—leading to modest improvements from 2023 lows. We maintained this stance into early 2025 expecting further cuts and deregulation to spur exit activity via mergers and acquisitions (M&A) and, to a lesser extent, internal public offerings (IPOs). However, exits continued to trend downward from 3Q24 through 2Q25, with only a recent 13% quarter-over-quarter uptick in 3Q25, still down 13% year-over-year. Pitchbook projects 2025 exit counts will finish roughly 10% below 2024, though total exit value is estimated to improve by 36% YoY. We pivoted our sentiment to Neutral in mid-year 2025.
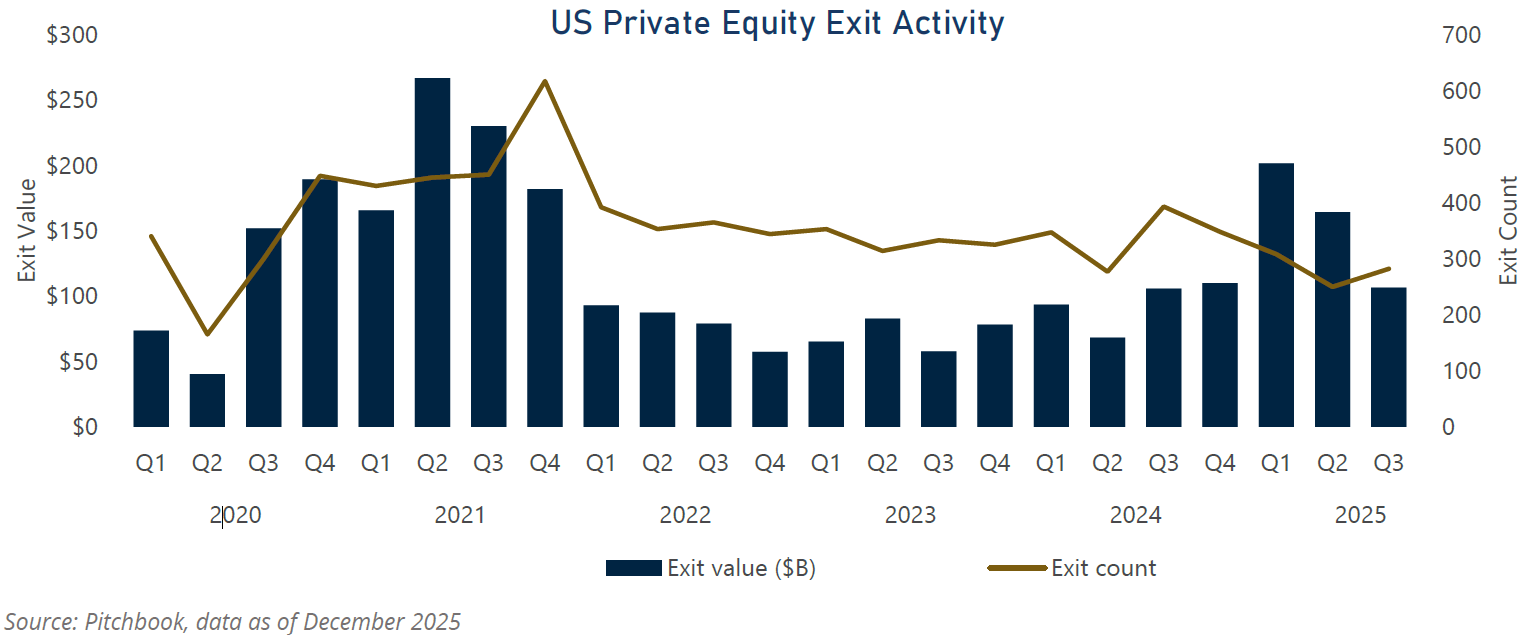
Our thesis—that rate cuts would drive exits—did not fully materialize, likely due to economic uncertainty driven by volatile tariff policies. Additionally, there now seems to be wide dispersion among Federal Reserve members as to whether to cut interest rates further, with some FOMC members advocating cuts amid a weakening labor market, while others cite sticky inflation tied to tariff policy as justification to hold off on further cuts.
Looking ahead, tariff negotiations appear less erratic, and inflation has been lower than expected, both of which could reduce uncertainty in 2026. If rates hold steady, exit activity may remain flat; if cuts resume, modest improvement is likely. We expect rates to decline next year, though timing and magnitude remain uncertain. Pitchbook’s recent survey aligns with this view—60% of respondents anticipate some improvement in exits in 2026.
Overall, we maintain a Neutral near-term outlook for Private Equity, as 2026 may resemble or slightly improve upon 2025. We continue to see opportunities in secondaries, lower middle-market buyouts, growth equity, co-investments, add-ons, roll-ups, and select industries, while avoiding mega-buyouts. We favor sector-focused managers (e.g., healthcare, business services, essential services, industrial/manufacturing) that drive earnings before interest, taxes, depreciation, and amortization (EBITDA) growth through operational improvements over those managers relying on financial engineering or multiple expansion.
JAS CHEN, CFA
Senior Analyst
We maintain a Neutral/Positive outlook on private debt, as we continue to identify attractive opportunities within the market. Over the past decade, private debt lenders have navigated contrasting environments—from near-zero interest rates post-pandemic to a rapid rise in rates—conditions unlikely to recur in the near term. During these extremes, yields on many private debt strategies ranged from 5–6% in low-rate periods to 10–12% in elevated-rate environments, illustrating the stress-tested range for private debt. The floating-rate structure of most private loans should help insulate returns against normalizing rates and persistent inflation.
Recent concerning headlines for private debt appear to be tied to isolated challenges rather than revealing systemic weaknesses. The most high-profile concerns in 2025 stemmed from controversial liability management exercises and alleged fraud/bankruptcy events at Tricolor and First Brands. Liability management transactions raised concerns about borrowers exploiting documentation gaps that disadvantaged lenders. These issues primarily occurred in the broadly syndicated loan (BSL) market, where documentation is looser. In contrast, private direct lenders benefit from tighter documentation that has evolved to mitigate such risks. Tricolor and First Brands’ bankruptcies were linked to opaque off-balance sheet financing and “double-pledging” collateral—again, largely tied to BSL debt. While fraud remains a potential risk, disciplined high-quality private lenders employ extensive due diligence and structural protections, including consent rights, direct borrower access, and collateral safeguards.
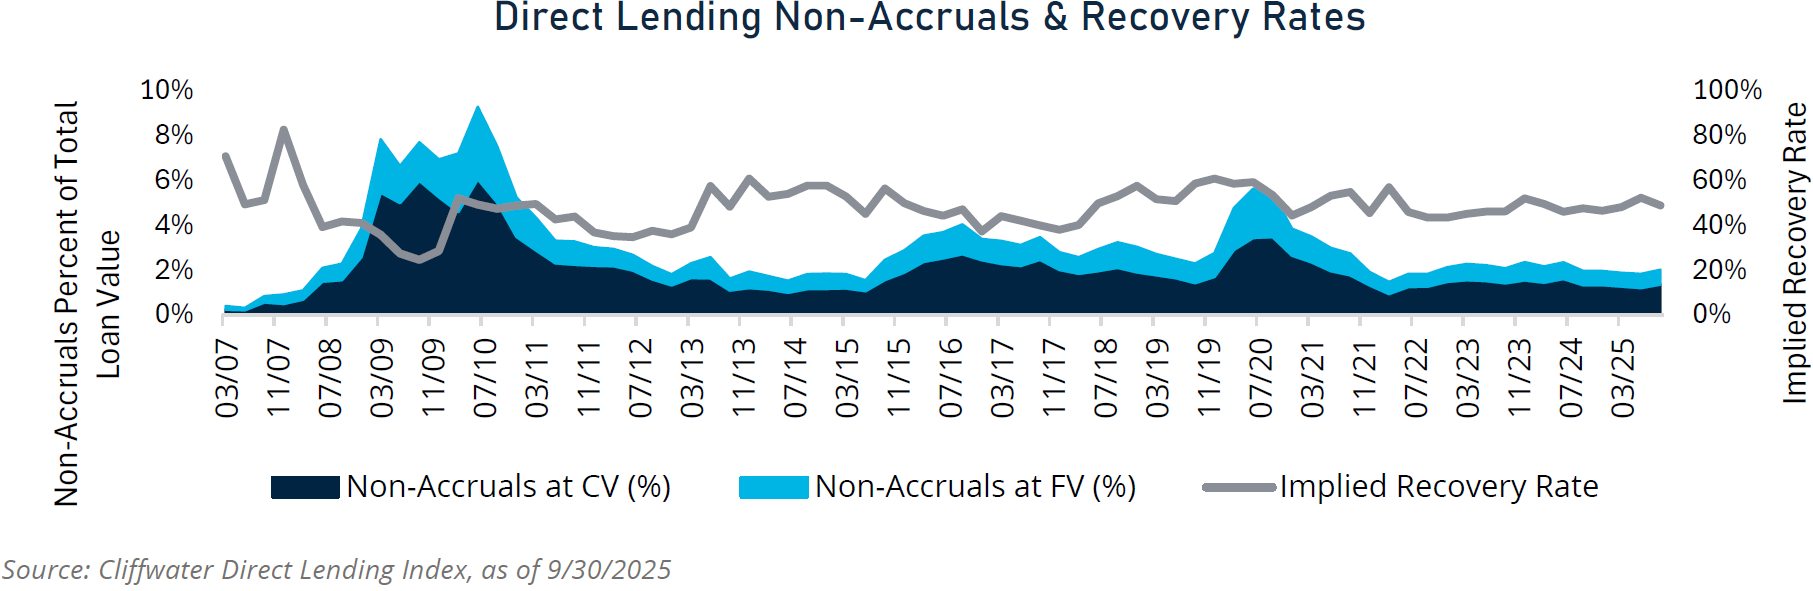
Fundamentals across private debt remain resilient. We have not observed widespread deterioration in revenue, EBITDA, or interest coverage ratios among direct lending portfolio companies in 2025, particularly for managers focused on senior secured lending. Default rates remain below historical averages and are expected to stay benign absent a recession, with recovery rates projected near 50%. While defaults cannot be eliminated, prudent portfolio construction, diversification, and experienced workout capabilities—qualities we prioritize in evaluating managers—help mitigate excessive potential losses.
Private direct lending historically benefited from higher yields and wider spreads as banks retrenched from lending due to regulatory constraints, creating a supply-demand imbalance in which borrower demand exceeded available capital. This dynamic is shifting. Direct lending has matured into a mainstream allocation for institutional investors, while democratization of private market strategies has lowered barriers for retail investors, introducing additional sources of capital. At the same time, competition from the broadly syndicated loan market has increased, further expanding capital availability for corporate borrowers. These developments have begun to compress yields and spreads in direct lending, particularly in larger markets where competition is most pronounced. We expect this trend to persist as supply-demand dynamics evolve, favoring the middle and lower middle-market direct lending space where yields and spreads remain relatively durable.
Direct lending remains a cornerstone of private debt, but the strategy is becoming increasingly crowded, which may lead to alpha decay over time. Given private debt’s tremendous growth, lesser-known strategies may benefit from the supply-demand imbalance that once favored direct lending. One such area is specialty finance, which falls outside traditional corporate lending. Within this market, we see opportunities in specialty finance strategies.
Specialty finance represents a form of lending in which loans are underwritten and secured (collateralized) primarily on the value of a borrower’s assets, ranging from traditional working-capital assets such as receivables and inventory to hard and niche assets like aviation and royalties. These loans and income streams are less tied to the corporate earnings cycle and tend to be structurally protected through collateral held in a special purpose vehicle, mitigating value destruction. Specialty finance loans typically have shorter durations and pay cash interest rather than accrued interest, which is becoming more common in direct lending. These transactions require specialized expertise, particularly in structuring and collateral underwriting.
Looking ahead, we expect private debt to remain a compelling source of risk-adjusted returns, supported by structural protections and disciplined underwriting. Opportunities persist in senior secured lending, sponsor-backed transactions, and specialty finance strategies. Specialty finance strategies paired with direct lending can offer attractive diversification and structural protections in an increasingly competitive private debt landscape.
MATT KUKLA
Senior Analyst
Syntrinsic began recommending private infrastructure investments in early 2024, with a Neutral-to-Positive near-term outlook. We maintained this stance through 2025 and continue to support it into 2026, as the underlying fundamentals of the infrastructure market remain intact.
Infrastructure assets typically provide essential services, benefit from high barriers to entry, and often operate under regulated frameworks with inflation-linked revenues—offering stability across economic cycles. As such, the asset class remains well-positioned for secular growth, supported by demographics, decarbonization, urbanization, digitalization, and fiscal policy. Global infrastructure needs are projected at over $100 trillion by 2040, with $23 trillion required for energy transition alone.12 Achieving these targets may be challenging given current investment shortfalls and recent US policy shifts toward hydrocarbons.
In addition to secular growth, AI-driven demand for data centers is a key theme; however, valuations have risen to 11.7x EV/EBITDA versus 10.2x for the broader infrastructure universe, reducing attractiveness at the margin. While future revenue may justify significant capex and borrowing, execution risk is high, and many investors may already hold substantial AI exposure via public equities. Meanwhile, aging US power grid infrastructure presents compelling investment opportunities as well as challenges for AI-driven demand.
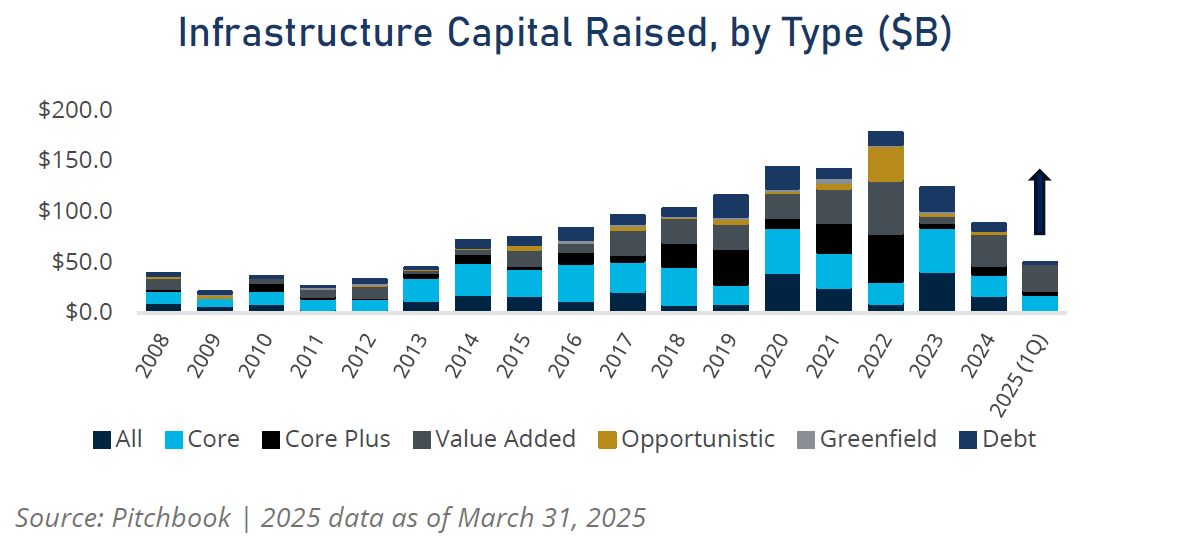
Infrastructure fundraising grew steadily from 2008 because of the low-interest-rate environment following the global financial crisis (GFC). Fundraising peaked in 2022 from when rates were zero following COVID-19 (there is a greater lag in infrastructure fundraising compared with other private market assets) and is largely an outlier. As the Federal Reserve began its tightening cycle in 2022, fundraising bottomed out in 2024. Fundraising for 2025 is as of 1Q25 and was at that point already half of 2024 levels. We anticipate 2025 fundraising will be higher than that in 2024 and may reach levels reached in 2023 as interest rates continue to decline and demand improves.
While we continue to favor the asset class broadly, our preference remains for small-to-middle market opportunities where operational improvements can be driven across core, core-plus, value-add, and secondaries strategies. We avoid large buyouts due to high leverage requirements and limited EBITDA growth potential in an elevated interest rate environment.
MATT KUKLA
Senior Analyst
Commercial real estate returns are primarily driven by income and, to a lesser extent, appreciation from net operating income (NOI) growth, while changes in cap rates—closely tied to interest rates—introduce valuation volatility.
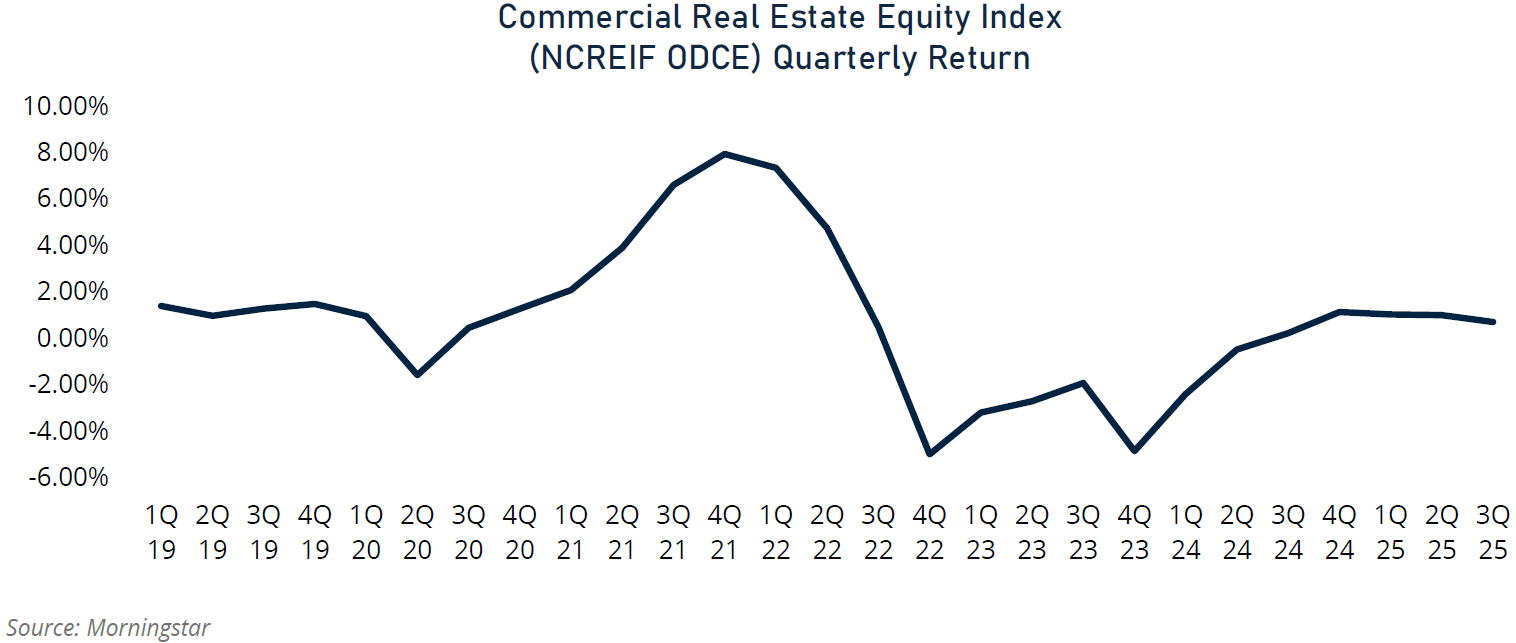
During the COVID era, Federal Reserve rate cuts boosted real estate returns through NOI growth and declining cap rates, driving significant appreciation. However, since the Fed’s tightening cycle began in 2022, rising cap rates have eroded valuations, offsetting income and NOI growth, resulting in negative total returns for nearly two years.
The NCREIF ODCE Index turned positive in 3Q24 and has now posted five consecutive quarters of gains, with a YTD return of 2.82% as of 3Q25.13 This improvement reflects income and modest valuation recovery from declining cap rates. Institutional capital is slowly re-entering, and redemption queues relative to NAV are trending down—a positive sign that negative returns may have bottomed. Moving forward, we expect a gradual recovery rather than a sharp rebound given current real estate loan fundamentals.
There are $1.26 trillion in commercial real estate loans made in 2015 that are maturing in 2027 that carry interest rates near 4%, compared with 6.5% for such loans made today. The maturity and refinancing uncertainty ahead cause us to maintain a Neutral sentiment on the commercial real estate market in the near term. A rapid decline in interest rates, strong NOI growth, or lender flexibility could mitigate risk, but none of those scenarios represent our base case.
Despite our concerns about the asset class, there are still some bright spots in certain sectors of the commercial real estate market, excluding office.
Access to these opportunities is possible through diversified managers, though we are not broadly recommending new allocations to the asset class at this time.
JAS CHEN, CFA
Senior Analyst
We maintain a Neutral near-term outlook on hedge funds. We expect some additional rate cuts and an overall more normalized interest rate environment in 2026, while the potential for market volatility remains. In this context, hedge funds employing absolute return strategies are becoming increasingly attractive given their typical characteristics—low volatility and uncorrelated return profiles—while their returns may be more competitive with fixed income given lower rates.
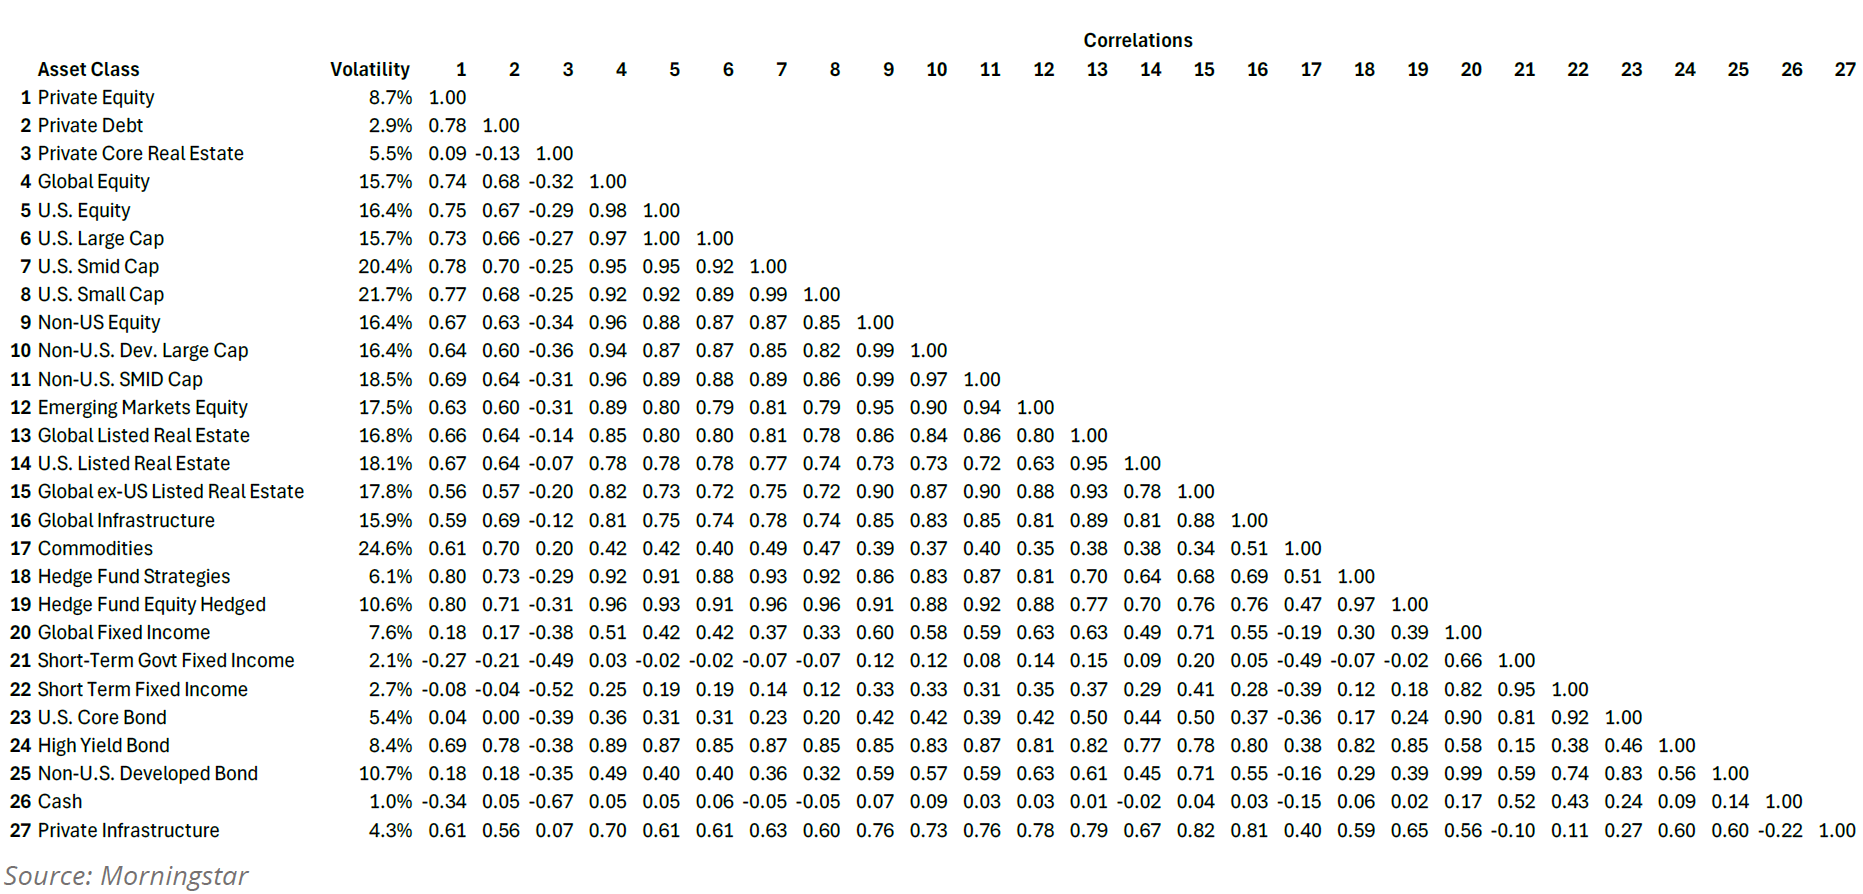
What serves as a diversifier? Fixed income’s correlation to global equities has increased. This trend has been observed since 2021, when inflation became a dominant risk factor, followed by a rapid rise in interest rates, and now by sticky inflation above target. We expect persistent pricing pressures, driven by tariffs in the near term, which may reduce the historically uncorrelated benefits of fixed income, as correlations between bonds and equities tend to break down under these conditions. Additionally, private equity, debt, and infrastructure assets may also be closely tied to the corporate earnings cycle. Uncorrelated hedge fund strategies do exist within the broader universe; however, manager selection remains critical due to the significant dispersion in returns.
Unlike other alternative strategy types, with hedge funds, institutional investors dominate the space due to high minimums and qualification requirements. Funds of funds and multi-strategy vehicles offer a practical path to diversification across market environments, mitigating the cyclicality and manager-specific risks of single-strategy funds.
Fees and structural considerations remain key hurdles. Hedge funds typically follow a “2 and 20” fee model (2% management, 20% performance), with additional pass-through fees possible. Our long-term hedge fund assumptions anticipate managers simply earning back their fees in alpha, but the goal of manager selection, as in other asset classes, is to identify managers that can outperform the asset class. Potential investors must meet minimum investment levels, as with other alternative asset classes. Lastly, liquidity constraints and limited transparency underscore the importance of alignment between managers and investors.
While acknowledging these (addressable) challenges, we note that macro conditions and structural trends around access create potential tailwinds for hedge funds, driving increased investor interest for reviewing potential allocations in 2026. We favor established managers with strong alignment to limited partners—offering transparency, investor-friendly structures, and competitive fees.
MATT KUKLA
Senior Analyst
We maintain a Neutral/Negative near-term outlook on commodities, reflecting limited conviction in the asset class over the next year. Other diversification tools offer more favorable return potential and better risk-adjusted profiles. While commodity exposure can appear indirectly through equities, debt, and hedge fund strategies, we prefer dedicated allocations only when long-term fundamentals for commodity price growth are supportive.
According to the World Bank, global commodity prices are projected to decline by 7% in 2026, led by oil and food, marking the fourth consecutive year of price declines and a six-year low. This trend is driven by slowing global growth, oversupply, and weaker demand from China, driving commodity price declines even in a period of higher inflation.
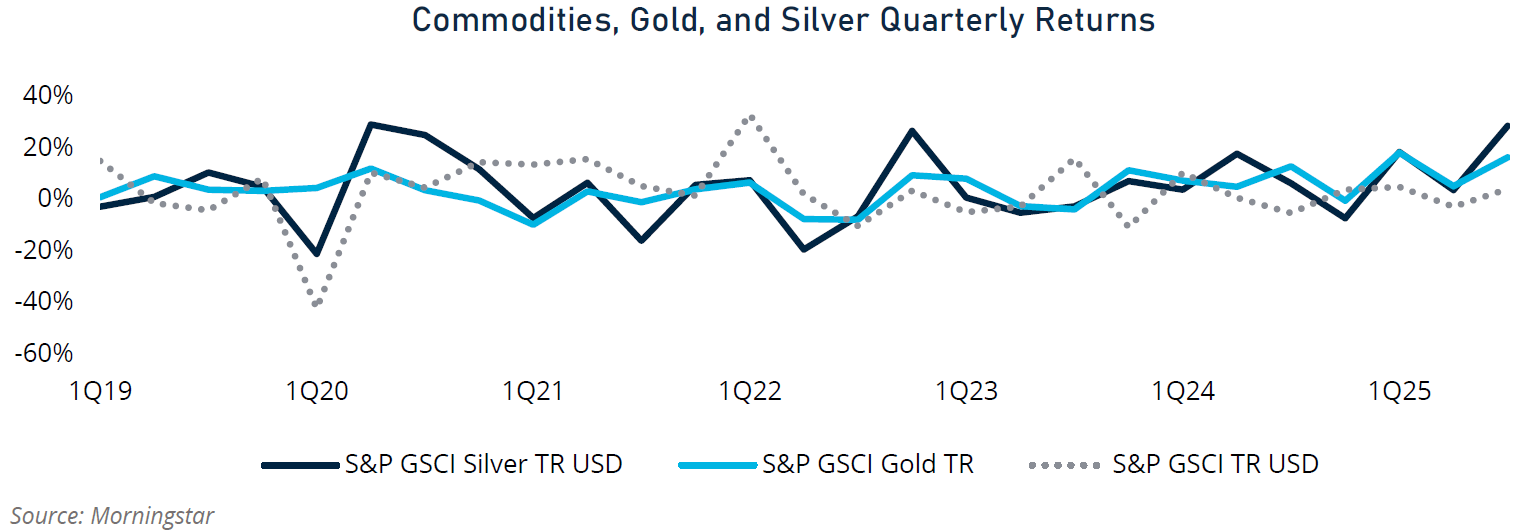
Commodities are often viewed as a hedge against environmental or geopolitical shocks, such as the 2022 Russia-Ukraine conflict that triggered sharp spikes in energy and food prices. However, using commodities for short-term hedging can be costly given their volatility and inflation-like return patterns outside of crisis periods.
Overall, declining commodity prices are helping stabilize the global economy, but near-term fundamentals remain weak. We prefer to allocate to commodities selectively when structural tailwinds and long-term fundamentals justify the exposure.

ROBIN MEYER, CFA
Director
ELI DAVIDOFF
Research Analyst
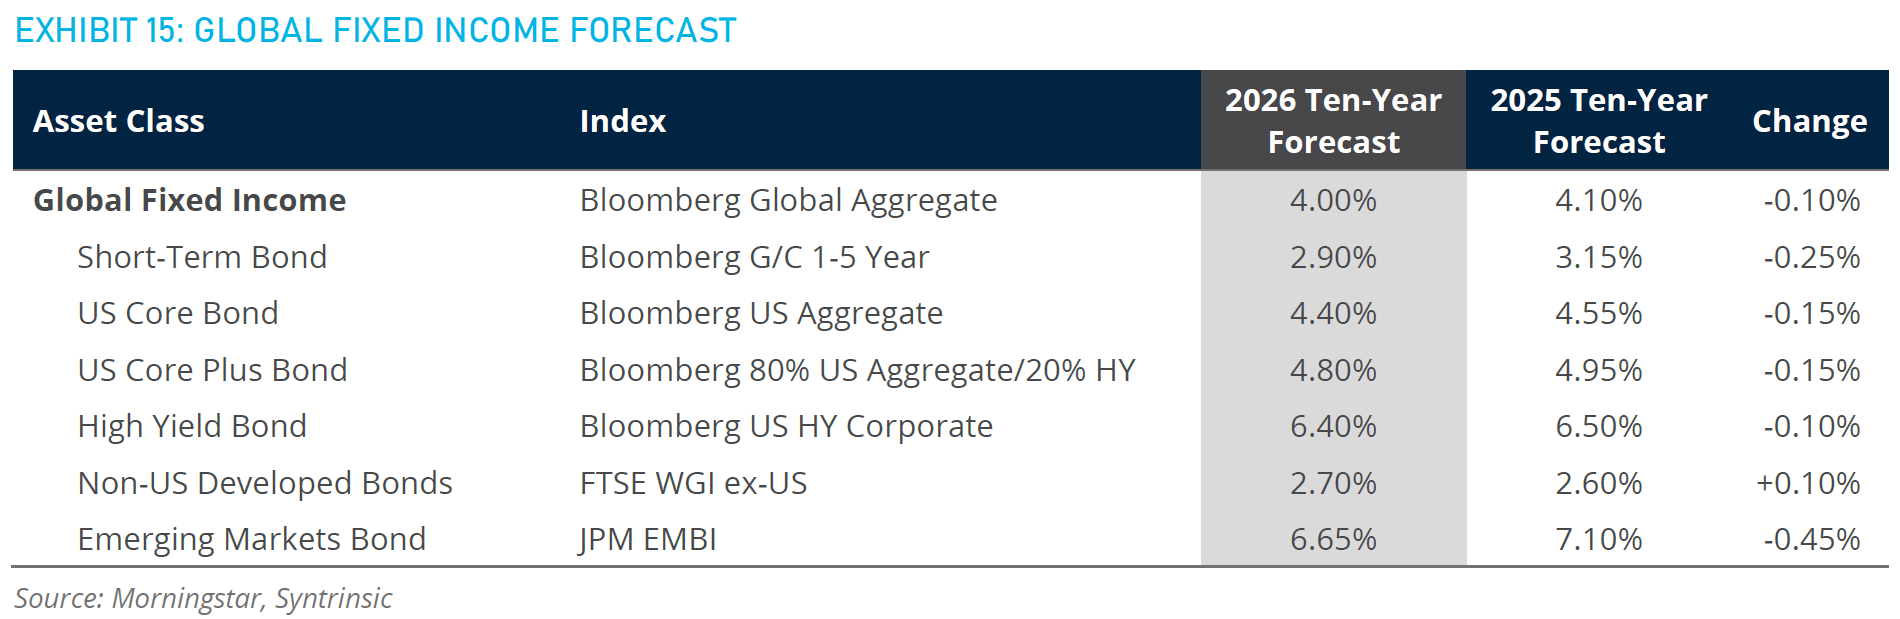
Our near-term outlook on Global Fixed Income remains Neutral/Positive as we enter 2026.
The past year saw no major credit events and little change in broad credit spreads. US monetary policy remained stable for most of 2025, with three rate cuts late in the year. The US Treasury yield curve, which began 2025 relatively flat, experienced bull steepening—yields declined across all maturities, with shorter-term rates falling more sharply. Healthy coupon income, stable credit spreads, and favorable yield movements combined to deliver mid- to high-single-digit returns from public fixed income exposures.
While slightly lower market yields reduce the overall opportunity set, a steeper and more differentiated yield curve creates opportunities for active managers to add value through duration and sector positioning.
We continue to feel positive about including public fixed income in most portfolios given its role in diversification and income generation. As we enter 2026, our outlook across fixed income segments reflects a generally constructive environment, with nuanced positioning by segment:
2025 Spread Dynamics
Credit spreads were largely absent from the broader bond market narrative in 2025, overshadowed by monetary policy decisions, FOMC staffing changes, and concerns over Fed independence. However, this absence masks significant intra-year volatility. Spreads widened sharply across all credit segments during and immediately following Liberation Day before recovering by summer and remaining stable until late fall.
Credit markets experienced late-year weakness, with lower-quality segments facing renewed pressure into November. The spread, or additional yield compensation for credit risk, of high yield bonds reached 3.15% by 11/30/25, up from 2.88% at the start of the year. CCC-rated segments saw more pronounced widening, partly reflecting negative sentiment from the private debt market, which faced some adverse headlines (see our separate discussion of private debt).
Credit Fundamentals & Risks
Despite these fluctuations, we believe credit fundamentals remain broadly supportive across both securitized and corporate markets. However, valuations are tight, particularly in below-investment-grade exposures. This reinforces our preference for active managers with strong credit underwriting capabilities to navigate dispersion and mitigate risk.
The appeal of short-term bonds has weakened slightly as market interest rates declined following three 0.25% Fed Funds rate cuts in 2025 and the market’s response that has led to lower yields at the front end of the yield curve. While the structural arguments of lower interest rate risk and lower return variability persist, the carry—or compensation provided by these exposures from coupon due to the passage of time—has become less robust. Given the variety of pressures on the Fed to further reduce rates, the monetary policy picture for 2026 looks primed to continue this trend. As a result, we will continue to guide clients towards a market duration that is commensurate with their risk profiles.
Core bonds continue to play a useful role in portfolios. While yields declined across maturities in 2025, intermediate-term steepening supports active management opportunities. Despite a smaller overall opportunity set, compelling carry and positive real yields sustain our constructive view. While the negative returns experienced in core bonds during 2022 are still fresh in investors’ minds, absent a swift uptick in domestic inflation, we remain optimistic that the segment will have more differentiated returns when equity markets face risk-off pressures.
While we are wary of valuations at cycle tights among many spread sector segments, we believe the opportunity set still exists for the core plus bond segment to add value to client portfolios. Our narrative on core plus bonds has historically focused on traditional high yield fixed rate credit and floating rate loan sectors, yet the appeal of core plus bonds includes the vast category of structured credit that includes asset backed securities (ABS) and non-agency mortgage-backed securities (MBS). Particularly among ABS, which encompasses a variety of sub-sector segments with consumer and non-consumer-oriented collateral, there continues to be a strong ability to enhance income above government bond yields. When seeking to implement exposure to the segment, we continue to employ active managers with less encumbered mandates to pursue attractive opportunities and avoid areas where risk is mispriced and/or unappreciated.
Many developed economies outside the United States have maintained a policy of monetary easing, a shift that follows a period of tightening prompted by the impacts of the COVID-19 pandemic on inflation and overall economic stability. Currently, within developed markets, the European Central Bank has taken the lead over the US Federal Reserve by implementing interest rate reductions earlier, as inflation within the euro-area declines. In contrast, the Bank of England has adopted a more cautious approach, given the persistently high inflation rates and the sensitivity of mortgages to changes in policy rates. The Bank of Japan is moving toward normalization by raising rates after a prolonged period of ultraaccommodative policy, allowing for greater movement in yields and pushing short-term rates out of negative territory, although it continues to maintain one of the most accommodative stances among developed markets. Both the Bank of Canada and the Reserve Bank of Australia are aligning their policies with those of the Federal Reserve, progressing toward interest rate reductions while emphasizing the necessity of data-driven decision-making.
In terms of performance, there has been a notable trend this year in which foreign bonds have outperformed those within the domestic market. Foreign developed bonds as measured by the Bloomberg Global Aggregate Ex-US index returned 8.2% through November 30th, while US bonds as measured by the Bloomberg US Aggregate Bond Index returned 7.5%. However, it is essential to analyze the underlying components of bond returns, which consist of price return, coupon return, and a currency return component for foreign bonds. The price return and coupon return represent the most sustainable sources of total return for a bond, whereas currency fluctuations can result in variable and often significant gains or losses. Through the time of this writing, the currency return from foreign developed bonds has comprised a significant portion of the overall return for these bonds, primarily attributed to the depreciation of the dollar during this period. We contend that returns predominantly influenced by a weakening dollar are not sustainable.
Furthermore, the implications of geopolitical conflicts contribute to our cautious stance regarding the inclusion of non-US dollar-denominated bonds within a portfolio. Additionally, the yield curve in the United States remains comparatively favorable, as it offers higher yields than most other developed markets. Consequently, the capacity to secure elevated yields continues to favor US dollar-denominated bonds.
Emerging market bond indices, in both hard currency and local currency denominations, have delivered strong returns in 2025 and currently are offering compelling yields, with some well into the double digits. Central banks in emerging markets increased interest rates significantly ahead of the Federal Reserve, effectively mitigating inflationary pressures stemming from the COVID-19 pandemic. This proactive approach has resulted in the potential for substantial real interest rates when compared to domestic US dollar-denominated bonds. Additionally, emerging market debt securities have experienced net upgrades thus far in 2025, driven by a rise in sovereign credit ratings. However, it is important to note that risks within the emerging market debt segment are highly idiosyncratic, influenced by trade and tariff measures aimed at specific nations, as well as targeted tariffs within the technology and electronics components sectors, along with the automotive industry. Furthermore, ongoing conflicts and regional instability have introduced spillover risks for adjacent emerging markets.
While a strong active manager can find compelling opportunities in emerging markets, the overall opportunity set remains Neutral due to the reasons mentioned above. We also believe the currency risk inherent in the asset class allows for a large dispersion in returns, depending on exposures. We do not recommend a dedicated investment allocation, continuing to favor delegating the pursuit of emerging market debt opportunities to those fixed income managers that have flexibility in portfolio allocations.
Our global equity forecast follows a bottom-up building block approach, beginning at the market capitalization segment level to derive a weighted average return forecast across US, non-US developed, and emerging markets. We start with large capitalization equities for each region, incorporating expected real economic growth, inflation, dividend yield, P/E valuation change, and trade effect adjustments. For US and non-US developed markets, return forecasts for small and SMID capitalization equities take into consideration their historical premium added to the large capitalization forecasted returns. The global equity return forecast represents the weighted average of regional forecasted returns using current world portfolio weights.
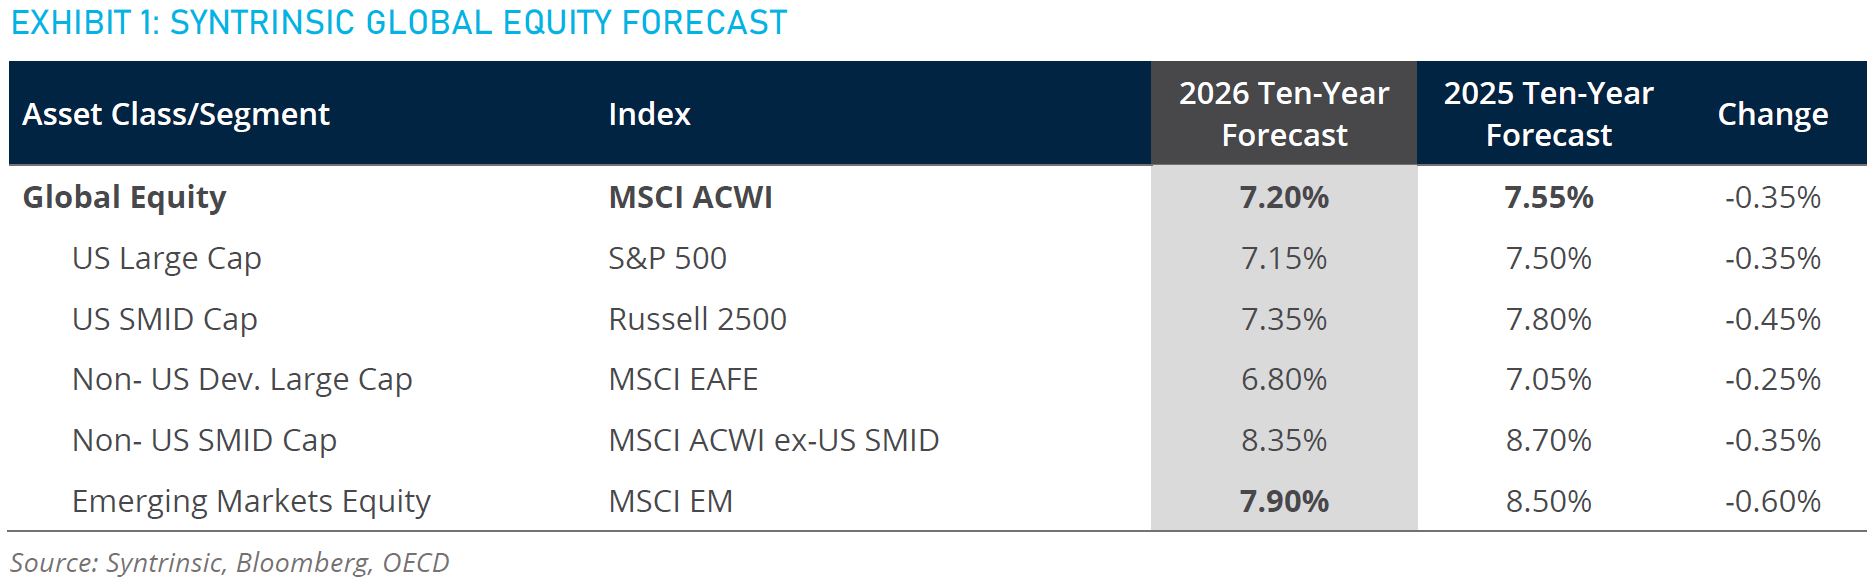
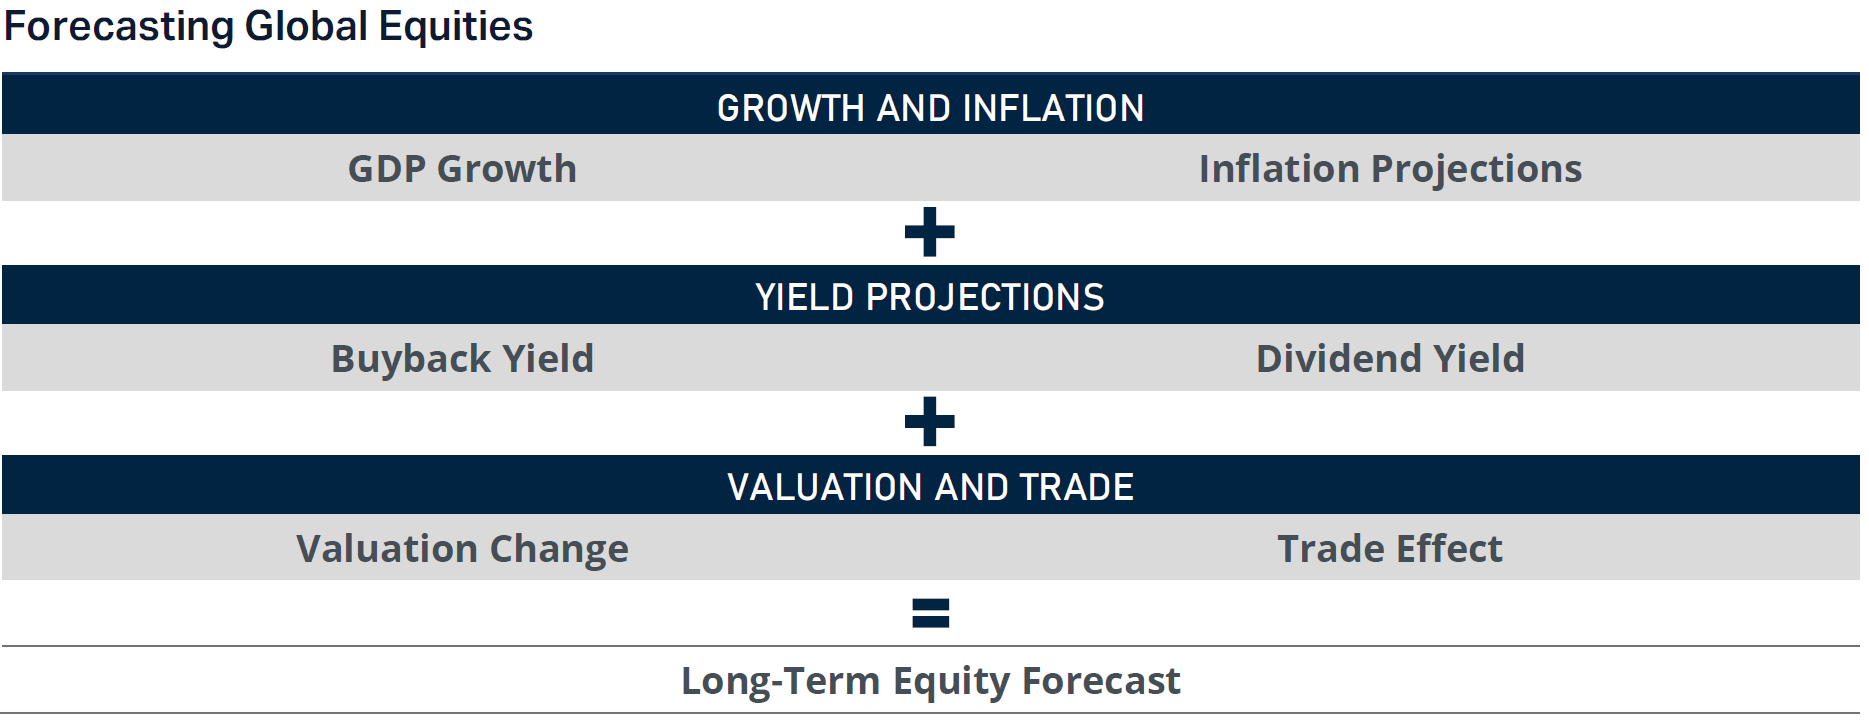
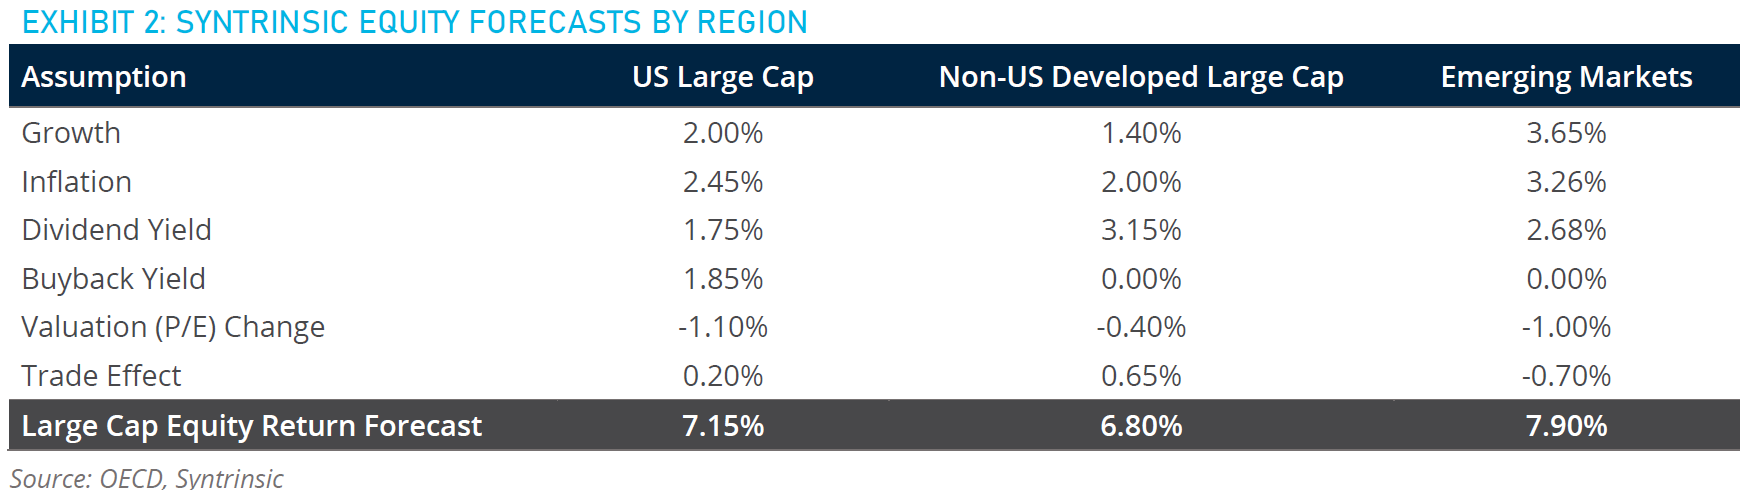
By summing the forecasts for real economic growth, inflation, dividend yield, P/E valuation change, and then adjusting for trade effects, Syntrinsic calculates the baseline results for large cap equities in each region.
In general, the valuation (P/E) change effect was an increasing negative for equity market forecasts relative to a year ago, offset by slightly higher expectations for real economic growth and inflation.
Small and midcap equities are often expected to provide a risk premium above large cap equities. Our research observes that the small and mid (SMID) cap premium has been positive for US equity markets in the long run. However, the historical small cap premium has been negative for about 30 years. We anticipate a return premium for SMID cap, but forecast that small cap US equities will continue to underperform large-cap. We expect a greater SMID cap premium in non-US markets.
Real estate as an asset class is highly idiosyncratic, with tremendous variation across types of exposures, particularly in private real estate. For forecasting purposes, Syntrinsic uses different methodologies for private real estate (See Private Investments) and real estate accessed through securities listed on public market exchanges, what is known as listed real estate.
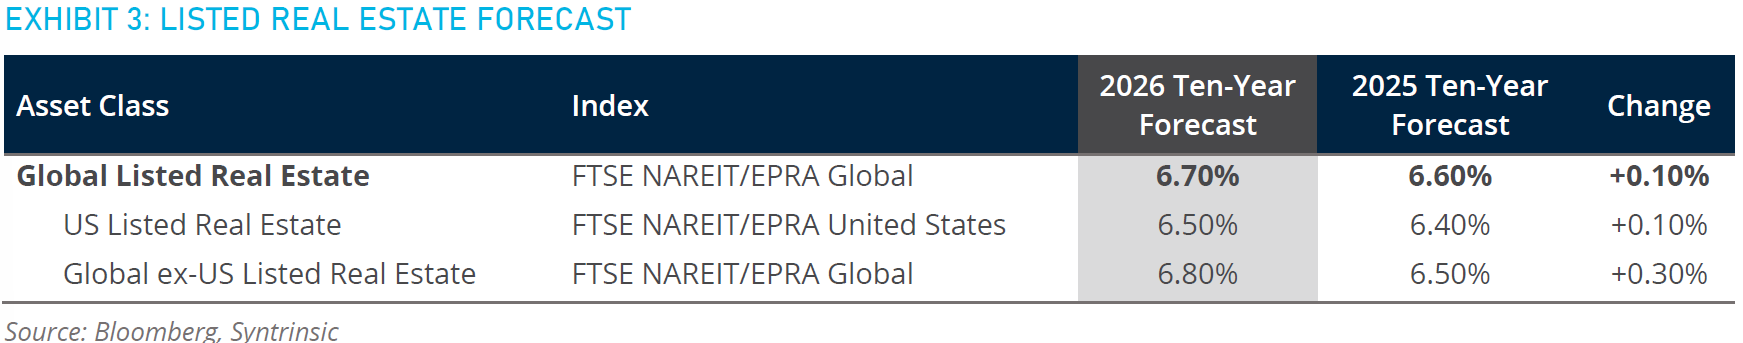
Investors that gain exposure to real estate through public markets generally invest in Real Estate Investment Trusts (REITs) and Real Estate Operating Companies (REOCs). While trading like equities, the structural differences and historic correlations of these securities result in Syntrinsic treating listed real estate as an asset class distinct from other equity sectors.
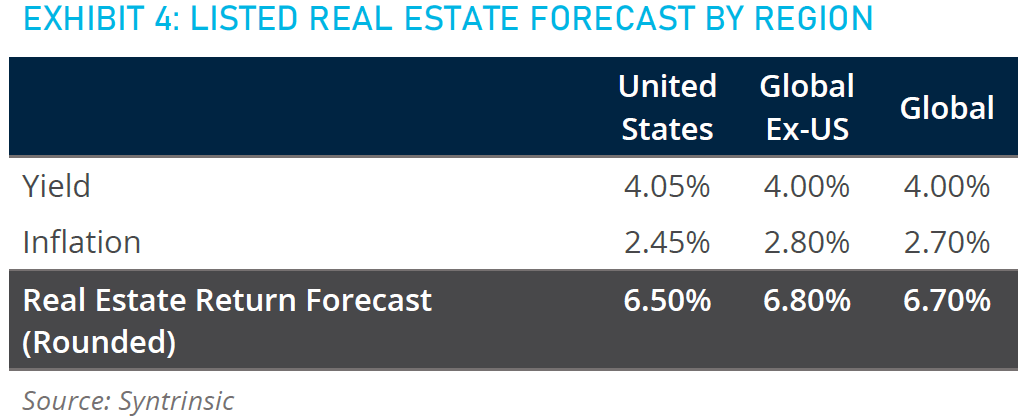
To forecast listed real estate returns, we start with current REIT yields (source for chart is Bloomberg). We then add an inflation forecast component appropriate to each region.

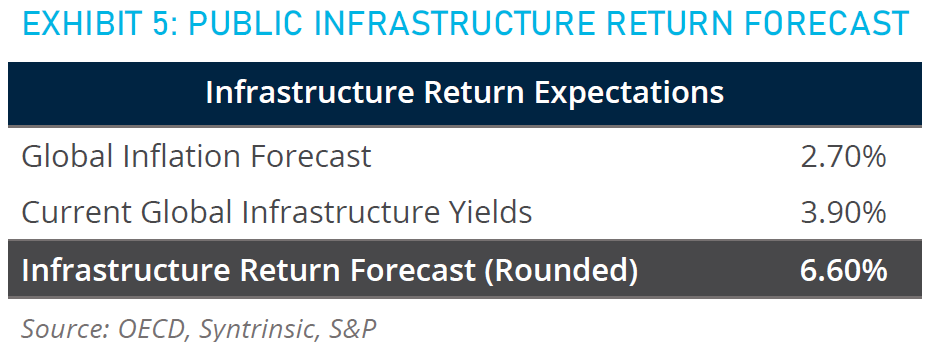
Syntrinsic views public (listed) infrastructure as a distinctive asset class within Real Assets that can provide inflation resilience and consistent returns within a portfolio. Our infrastructure forecast is based on historical global infrastructure yields and global inflation projections for a market index that includes the utilities, industrial and energy sectors. We consider historical global infrastructure yields and then add our global inflation expectation to account for cash flow growth we anticipate over the next 10 years.
While commodity-related investments manifest within equity and debt markets—and some hedge fund strategies—Syntrinsic views commodities as a distinctive asset class that might be worth dedicated investment depending on market conditions and investment objectives. Commodities include industrial metals (e.g., iron, copper), precious metals (e.g., gold, platinum), energy (e.g., oil, natural gas) agricultural products (e.g., wheat, soybeans), and softs (e.g., coffee, cotton).
Syntrinsic assumes that commodity returns will closely match global inflation. Given our regional inflation forecasts, we anticipate global inflation of 2.70% over the coming decade. We recognize that near-term environmental and geopolitical events can trigger price spikes or dips in certain commodities; however, we do not see such events as driving long-term fundamentals.
We discount or add to global inflation based on supply/demand dynamics and current demand trends for commodities. We use the historic 10-year rolling average spot premium over inflation, as a proxy for this premium or discount.
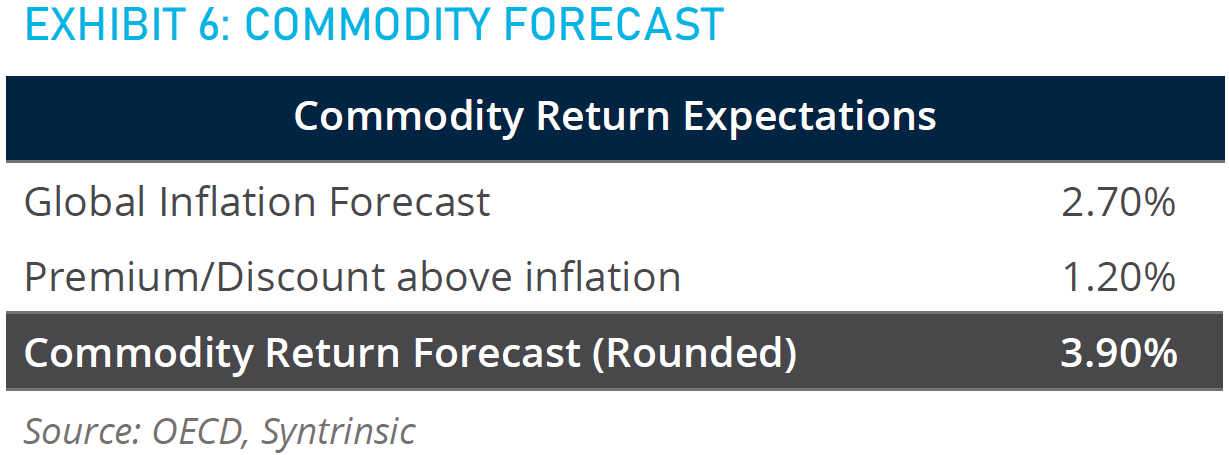
To determine the forward premium, we evaluated the premium seen during the last commodity supercycle (2000–2014) and added in a discounting factor as we do not anticipate that this cycle will be as extreme as the previous cycle based on demographics and technological factors.
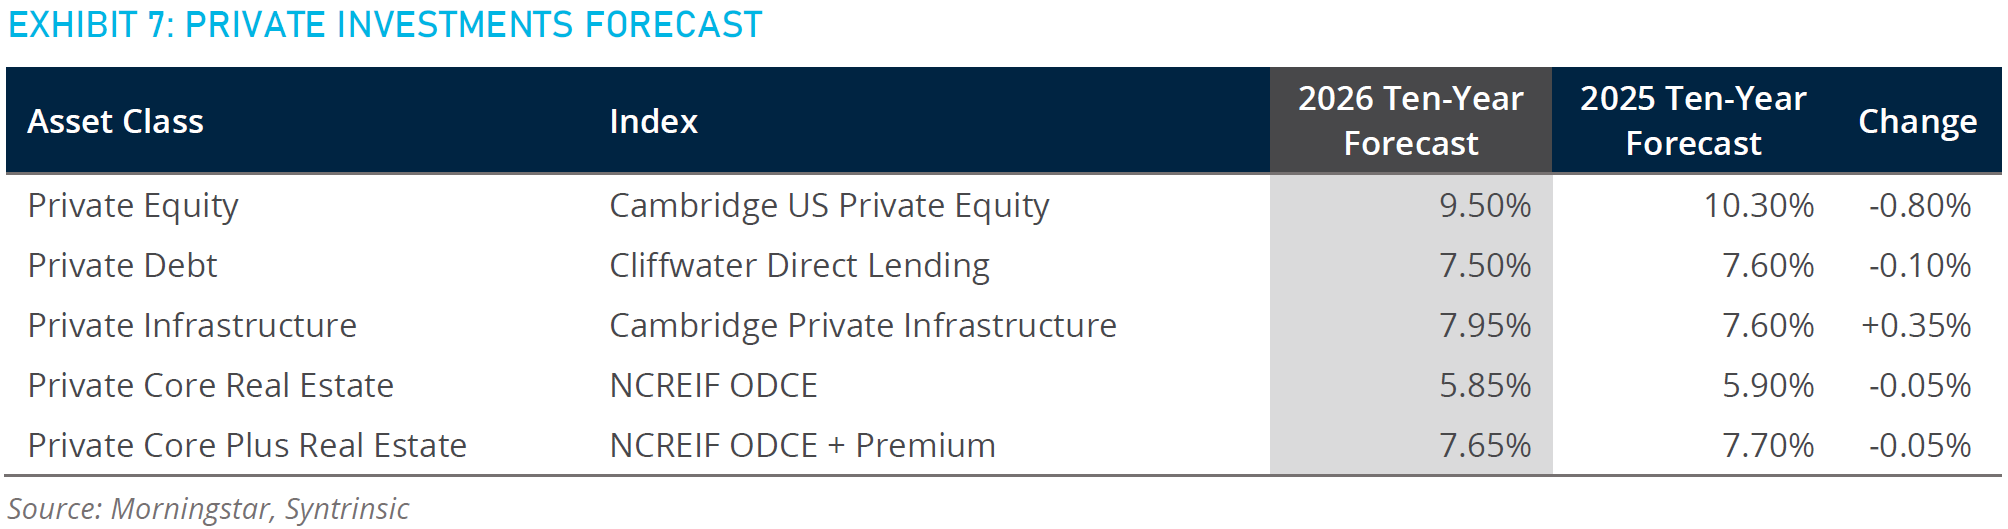
Syntrinsic’s forecast enables investors to model reasonable long-term return expectations; however, private equity, debt, and real estate investments exhibit so much dispersion in terms of strategy, style, sector, leverage, and other factors, that investors must strive to understand how specific investments might compare to the broad universe to a much greater degree than in traditional public market equity and debt investments.
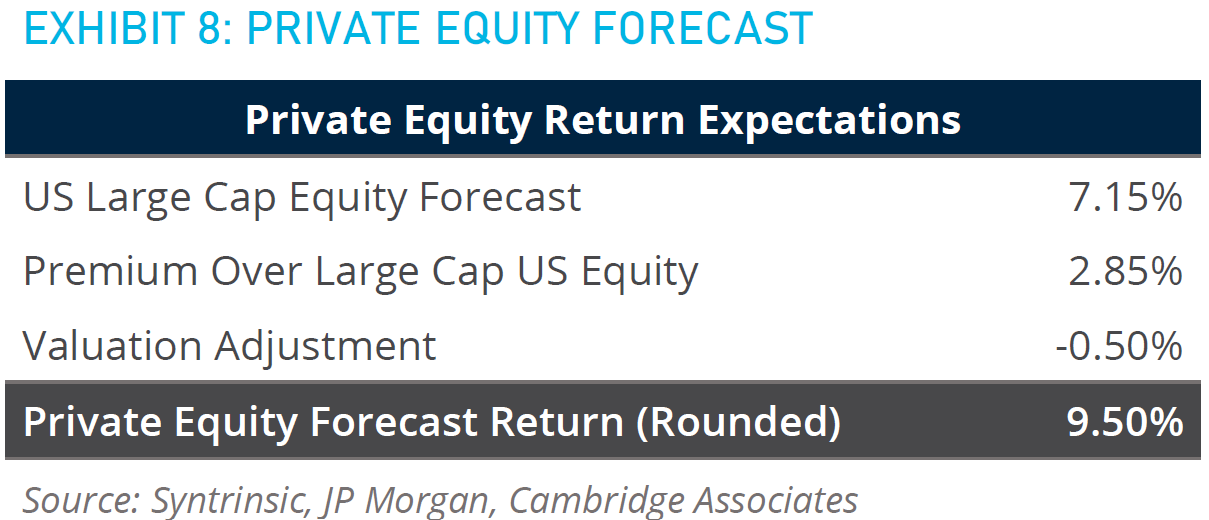
Forecasting Private Equity
Investors typically access private equity markets over public equity markets to earn a return premium in exchange for the additional risks and costs inherent in private equity, including illiquidity. As such, Syntrinsic forecasts private equity returns by analyzing the historic risk premium of the Cambridge Associates US Private Equity Index over the S&P 500 Index. Private equity expected returns decreased from last year, driven by lower expected returns on public equities, as well as a lower private equity risk premium driven by the recent environment.
Forecasting Private Debt
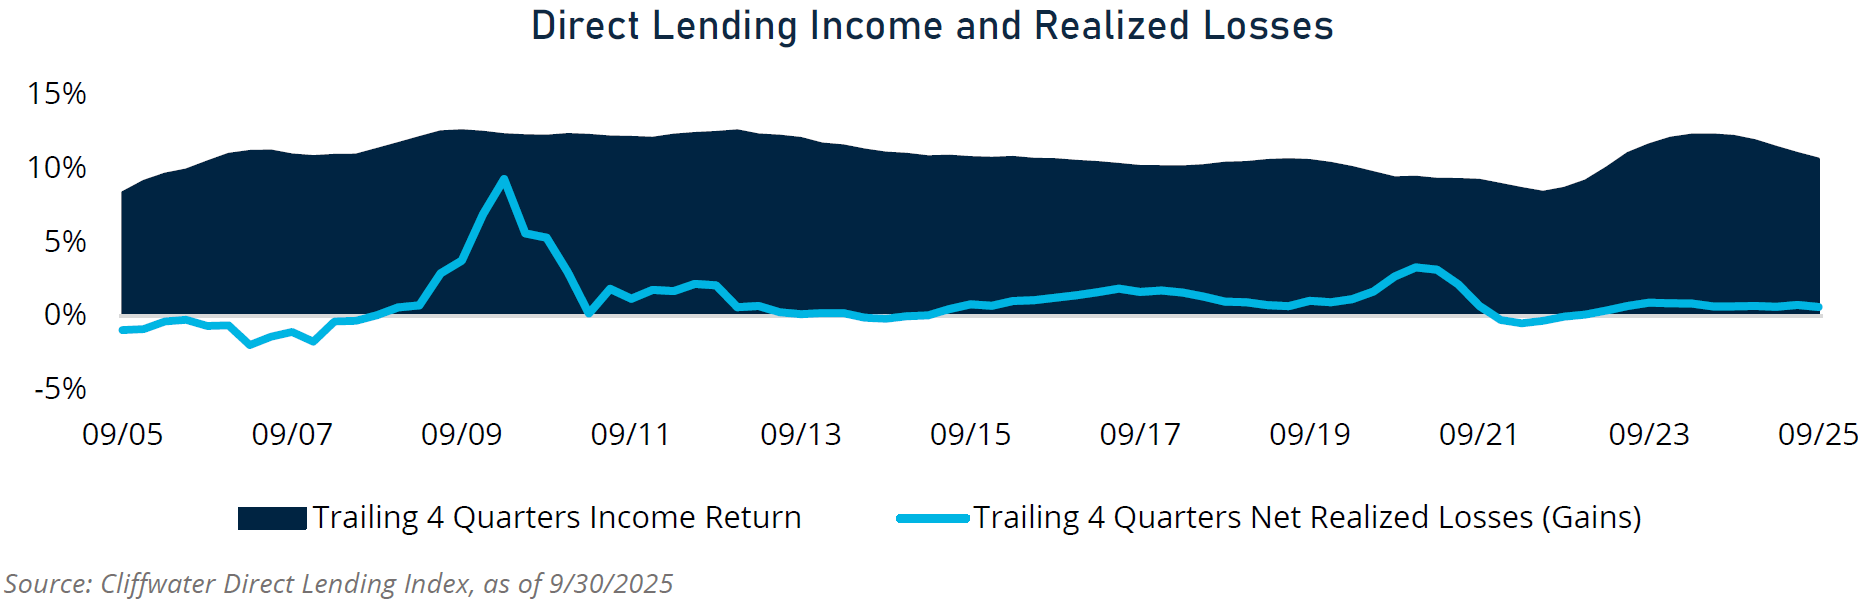
Private debt investment funds represent a pool of loans made to companies. Specific funds will vary in terms of sector, credit quality, and use of leverage, thus creating great dispersion across the asset class. Recognizing this, Syntrinsic’s private debt forecast relies on the historical direct lending premium of the Cliffwater Direct Lending Index return over US 3-Month T-bills. The Cliffwater index represents a broad array of private debt strategies, and accounts for observed credit costs, defaults, and losses net of recoveries.
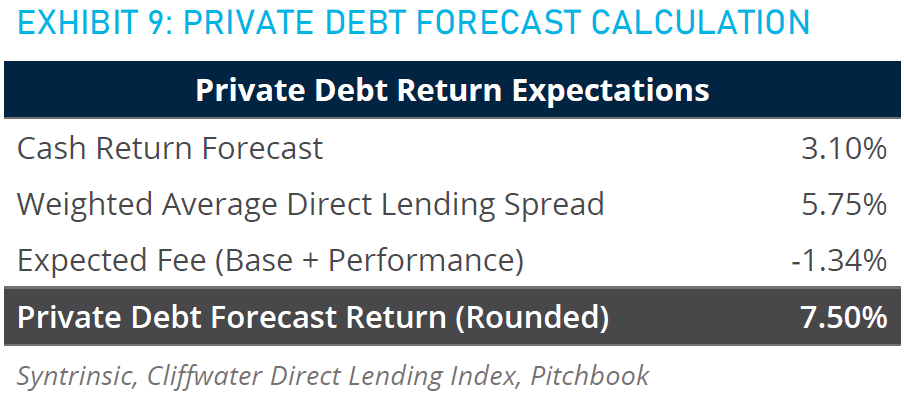
The Cliffwater Direct Lending Index serves as an industry-recognized proxy for the asset class. Our forecast reflects an unlevered return and incorporates historical average fee structures sourced from Pitchbook. Our base case fee assumptions account for ongoing fee compression trends, and includes a 1.25% base fee, a 7% hurdle, and a 15% performance fee (net of management fee).
Forecasting Private Infrastructure
Syntrinsic views infrastructure as a distinctive asset class within Real Assets that can provide inflation resilience and consistent returns within a portfolio.
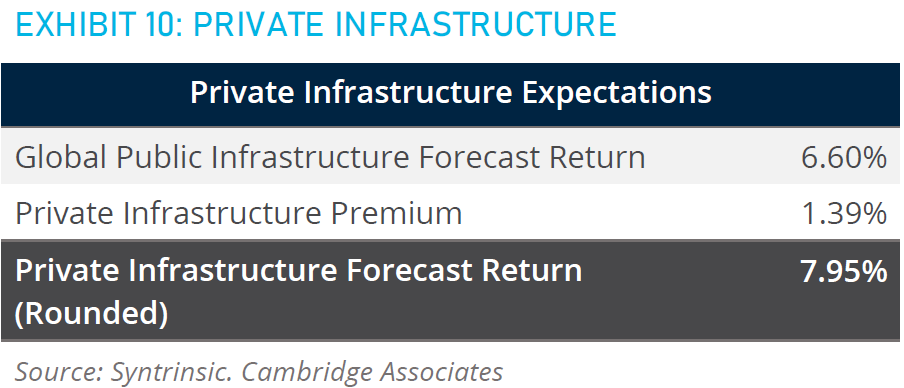
In addition to current yields for public infrastructure and global inflation projections, we include a return premium to reflect additional risks and costs inherent in private investments, including liquidity. As such, Syntrinsic forecasts private infrastructure returns by analyzing the historic risk premium of Cambridge Associates Private Infrastructure Index over the S&P Global Infrastructure Index.
Forecasting Private Real Estate
Syntrinsic organizes private real estate most broadly into two categories: core and core plus. Core private real estate represents diversified pools of high quality, mature US real estate properties diversified across sectors and geography. Returns are driven primarily by cash flows of those properties and some return due to realized gains. Core plus private real estate includes core properties as well as some more aggressively positioned properties that seek to add value through improvements, resale, and other activities.
For core private real estate, Syntrinsic starts with current capitalization rates and global inflation projections. Valuation changes from property prices and net operating income reflect the rate of global inflation projections. We expect controlled but higher default rates given the approaching debt maturity wall. Lastly, we reflect management and performance fees based on the difference between net and gross 10-year annualized return on the NCREIF Index.
Meanwhile, core plus private real estate strategies have a historical premium of 1.8% over the Core Real Estate as measured by the NCREIF Property Index. While there may be times when investing in core private real estate makes sense, we recommend that investors in private real estate focus their efforts on core plus investments that could add value.

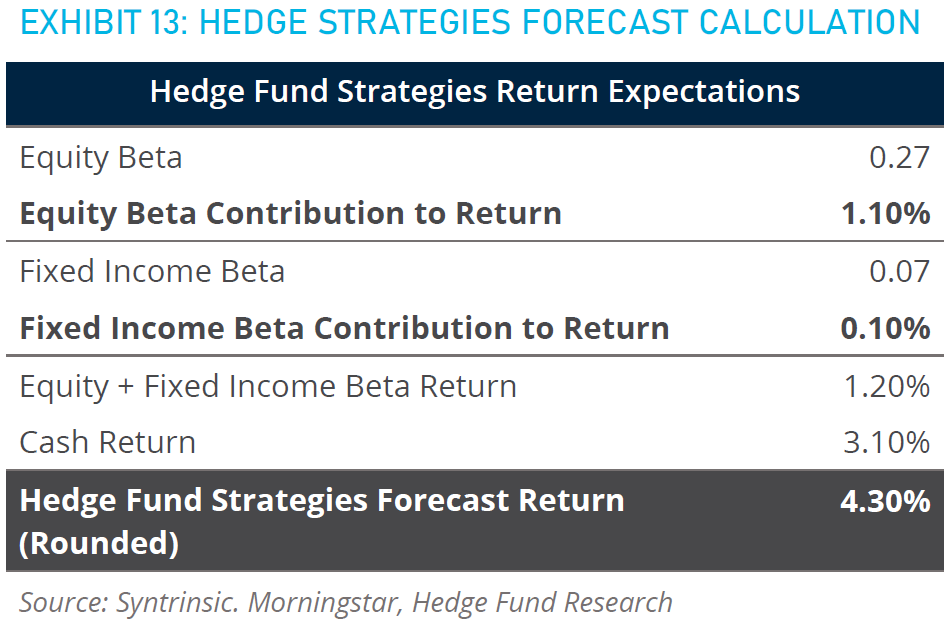
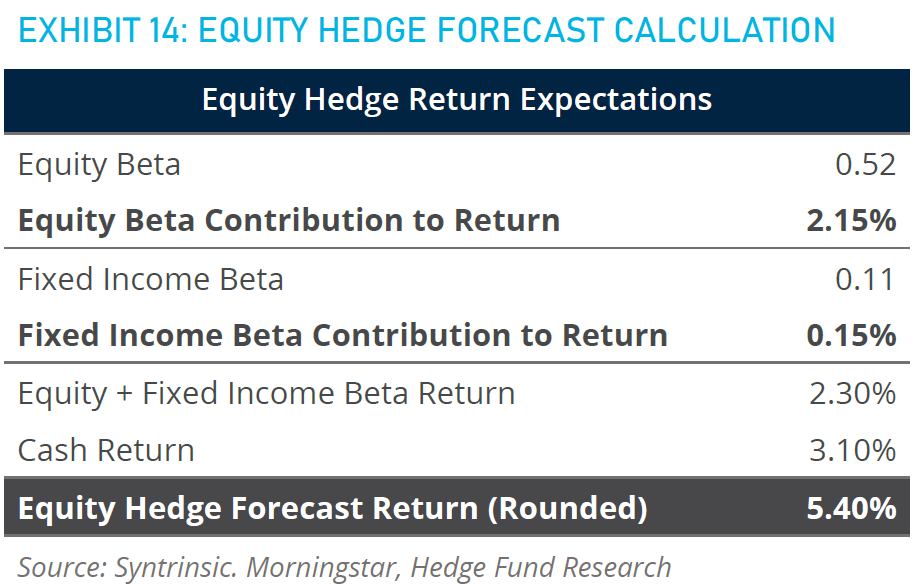
Hedge fund strategies encompass myriad trading methodologies across multiple asset classes and with different investment and risk management objectives. Syntrinsic draws upon industry practices in concentrating our forecast on equity and fixed income beta with additional support from cash returns.

The equity and fixed income beta components recognize that while hedge funds represent a highly diverse universe, historically their bottom-line results as an asset class have had consistent correlation with equity and fixed income markets. To determine the appropriate beta for the different hedge fund strategies, we analyze the historic beta and correlations to global equity markets, fixed income markets, and the Hedge Fund of Fund universe. We then apply those beta estimates to our long-term return forecasts for equity and fixed income to establish a return forecast for different hedge fund strategies.
The cash component of our forecast considers the elements of hedge fund return attributable to short rebates and interest earned on cash being held as an investment or as collateral for leverage.
Like other alternative asset classes, and unlike traditional public market assets, hedge funds are an actively-managed investment, where manager skill and alpha is a central part of the story. That active management comes with higher base and performance fees. For the hedge fund asset class, we assume that these two factors balance out, with the average or typical manager earning back only its fees in alpha.
Forecasting Hedge Funds of Funds
Hedge fund of fund expected return speaks to strategies that represent multiple hedge fund methodologies such as equity hedge, global macro, relative value, and fixed income arbitrage. In practice, some strategies are developed by a single firm that incorporates multiple third-party managers, while other times a single manager will apply multiple strategies within a single investment fund.
Forecasting Equity Hedge Funds
A significant portion of the hedge fund universe is represented by equity hedge strategies. Even within that more limited segment, strategies vary in terms of long, short, and gross positioning, concentration risk, regional exposure, use of leverage, sector exposure and other factors. Nonetheless, equity hedge strategies overall have expressed a beta to the equity markets of 0.52, providing a useful reference point for forecasting the market segment.
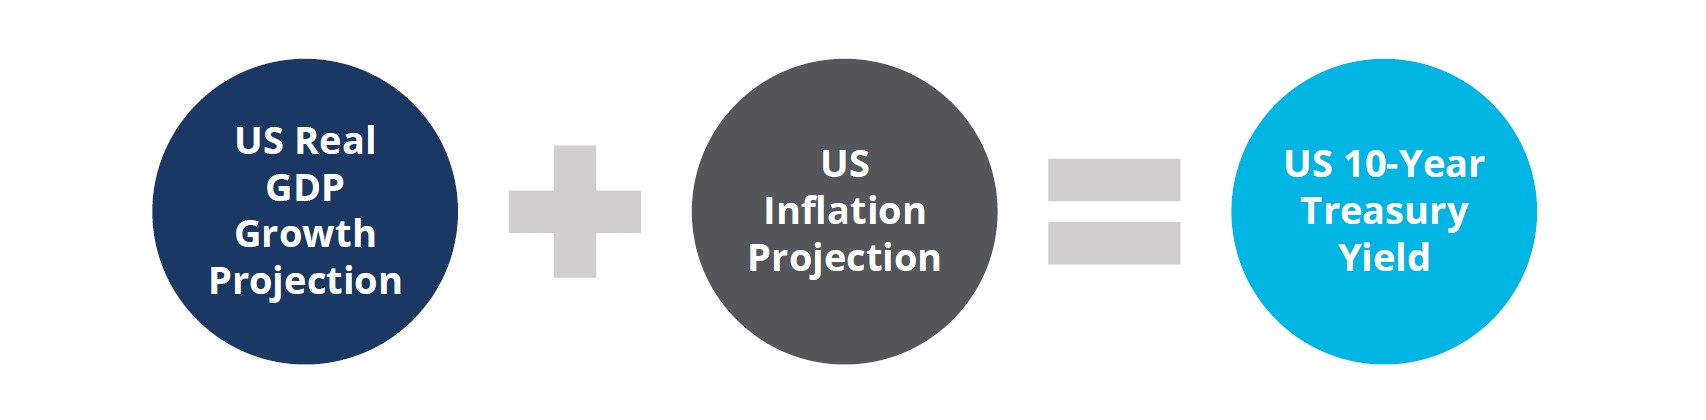
Syntrinsic expects that ten-year fixed income returns will be closely aligned with the average yield received over that ten-year period. While our forecasting process does allow for modest adjustments to current yields, we account for cyclical factors such as potential credit spread normalization and the status of monetary policy implementation in our near-term sentiment. To anchor our scenarios with reasonable assumptions, we consider long-term structural drivers of interest rates (growth and inflation), the path of the Fed Funds rate, and the term premium of interest rates. Over the last decade, other factors such as supply/demand dynamics that are a result of Fed intervention, structural changes in the economy, fiscal stimulus, and the relative attractiveness of US debt have influenced the level of long-term interest rates. We use our expectations for 10-year growth and inflation to determine the expected US 10-year Treasury rate.
Syntrinsic’s current projection for real GDP growth over the next ten years is 2.00%. Adding our 10-year inflation expectations of 2.43%, we anticipate the long-term 10-year Treasury rate at 4.43% (rounded to 4.45%).
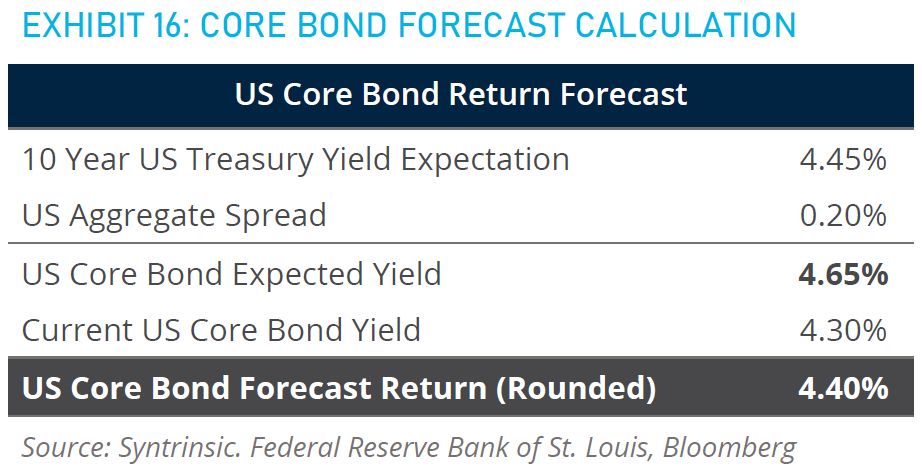
Forecasting US Core Bonds
US core bonds are represented by the Bloomberg US Aggregate Bond Index, which includes approximately 80% to US government bonds and 20% to investment grade US corporate bonds. Thus, to forecast reasonable returns for US core bonds, it is important to understand the premium (spread) of the US Aggregate over the risk-free rate, as well as likely scenarios for the movement of ten-year yields from where they are today to the expectations for the Fed Funds Rate and movement of the term premium.
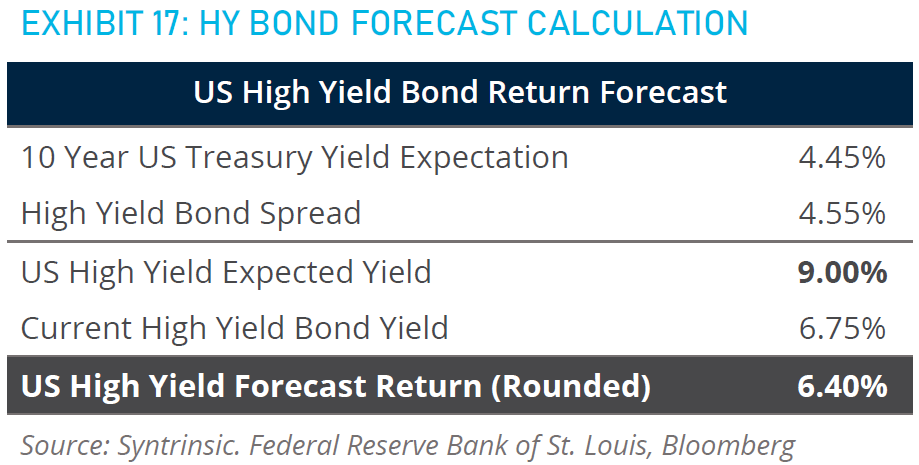
Forecasting US High Yield Bonds
US high yield bonds follow a similar pattern except that the spread between high yield bonds and the US Treasury Bond is higher to account for the additional risk.
Forecasting US Core Plus Bonds
In practice, many active fixed income managers seek to add value through incorporating more aggressive, higher-yielding bonds into a portfolio of primarily investment grade securities. Syntrinsic considers such an approach to be “core plus” with the “plus” acknowledging the additional risk and potential return of such a strategy. While every fixed income manager is unique, we model the broad US core plus strategy type as a blend of 80% US core bond and 20% US high yield bond.
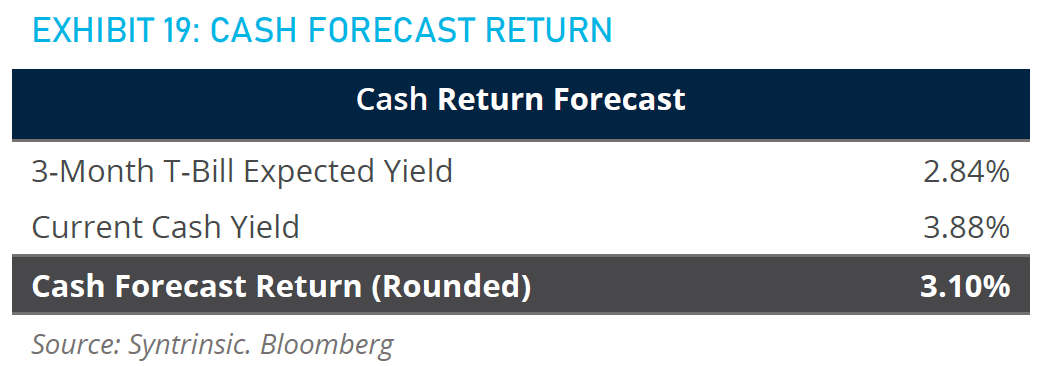
Forecasting US Short-Term Bonds and Cash Alternatives
To anchor our approach, Syntrinsic relies on historic spread relationships between the 10-year US Treasury Bond, 2-year US Treasury Note, Fed Funds Target Rate, and 3-month US Treasury Bill.
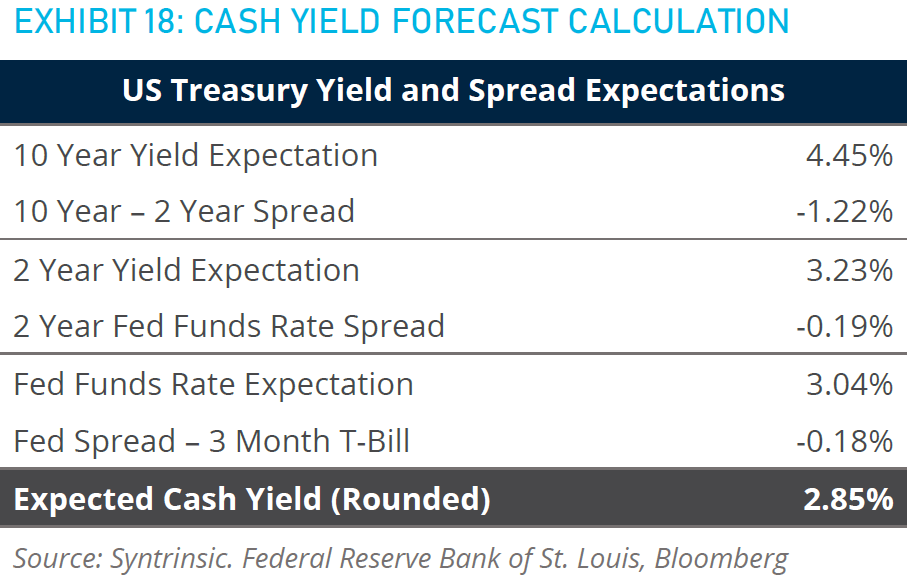
While these relationships are not set in stone and can vary over the short term, they provide reasonable guidance for longer-term planning.
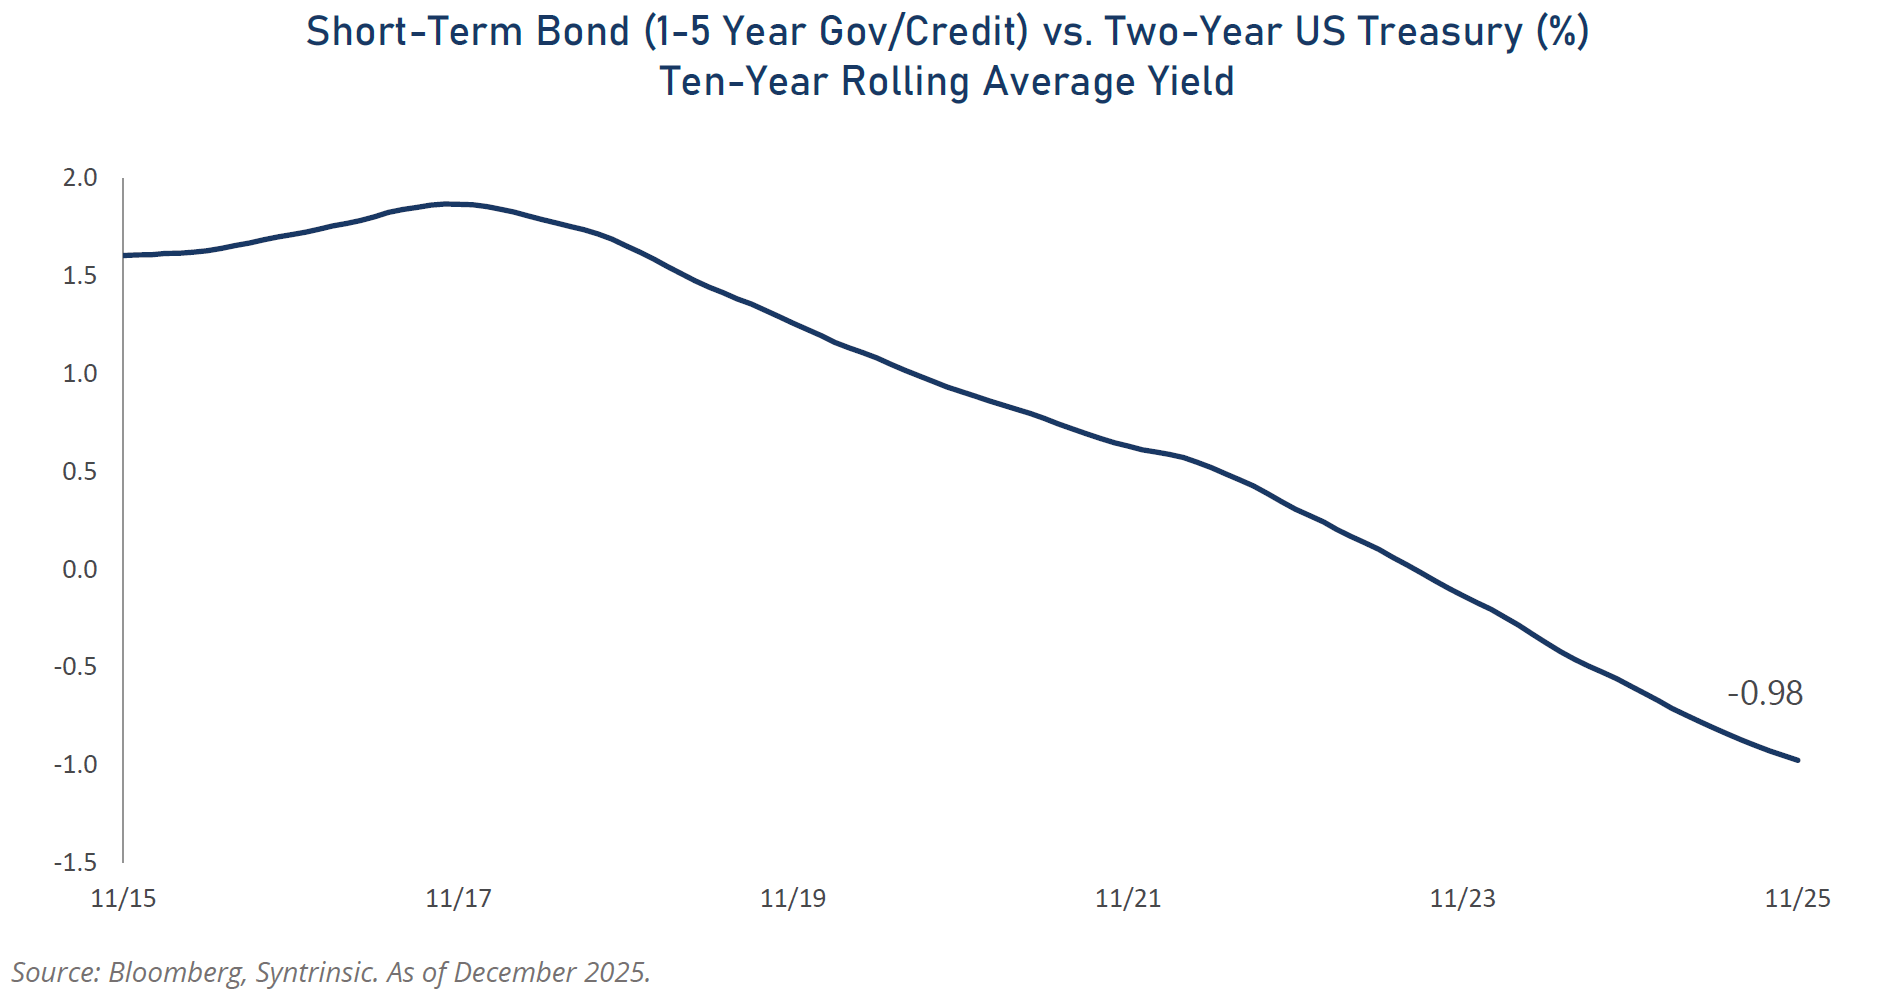
Syntrinsic short-term bond yield expectations extend spread analysis from the above to include credit.
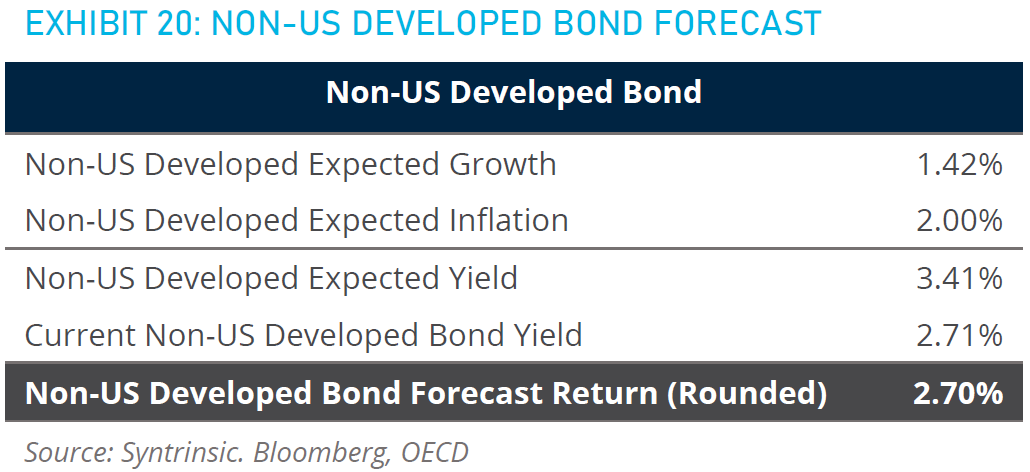
Forecasting Non-US Developed and Emerging Market Bonds
Syntrinsic develops forecasts for developed non-US bonds starting with components of expected inflation and real GDP growth.
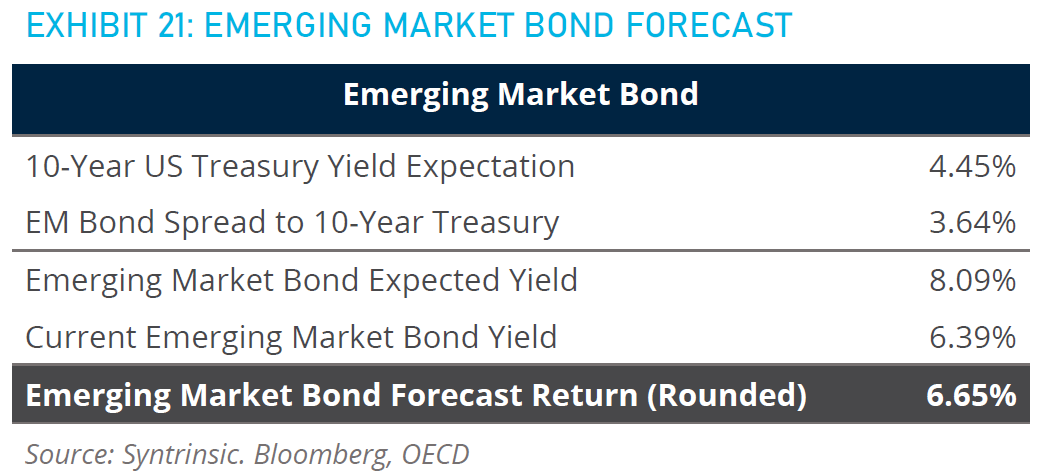
Bonds have become an increasingly useful tool in the emerging markets and represent many diverse economies and currencies. As such, the calculus for anticipating return requires a different approach. For our emerging market bond forecast, we use the long-term historical spread of emerging market debt to the 10-Year US Treasury bond. Based on our expectations for emerging market debt yields to move from current levels to our expected yield over the next five years, we anticipate ten-year returns of 6.65%.
Investment advisory services provided by IMA Advisory Services, Inc. (CRD#112091), a federally registered investment adviser, doing business as Syntrinsic. Registration as an investment adviser does not imply a certain level of skill or training. For additional information about our business, please review our Form ADV by visiting: https://adviserinfo.sec.gov and search for our firm name. Additional disclosures regarding Syntrinsic’s business can be found by visiting: Disclosure | Syntrinsic Neither the information nor any opinion expressed herein is to be construed as solicitation to buy or sell a security or as personalized investment, tax, or legal advice. One cannot invest directly in an index. Indices are unmanaged and do not reflect the deduction of fees.
The capital market assumptions and asset-class return projections presented herein are hypothetical, forwardlooking estimates and do not represent actual performance results of any asset class, portfolio, strategy, or account managed by the adviser.
These assumptions are based on the adviser’s current views, models, and assumptions regarding future market conditions, economic trends, asset-class behavior, and risks, which are inherently uncertain and subject to change without notice. Actual results may differ materially from those shown. Use of hypothetical performance carries significant limitations. Unlike actual performance, hypothetical results do not reflect the impact of actual market conditions, investment decision-making, liquidity constraints, transaction costs, taxes, or other factors that may affect real-world investment outcomes. There is no guarantee that any asset class, investment strategy, or portfolio will achieve results similar to those shown. These capital market assumptions are provided for illustrative and informational purposes only, to support long-term asset allocation and planning discussions with institutional investors. They are not intended to represent forecasts of actual investment returns, nor should they be relied upon as a promise or guarantee of future performance. This material is intended solely for use by investors who have the financial sophistication and resources to evaluate the risks and limitations associated with hypothetical performance information.